What the additional cores are actually doing
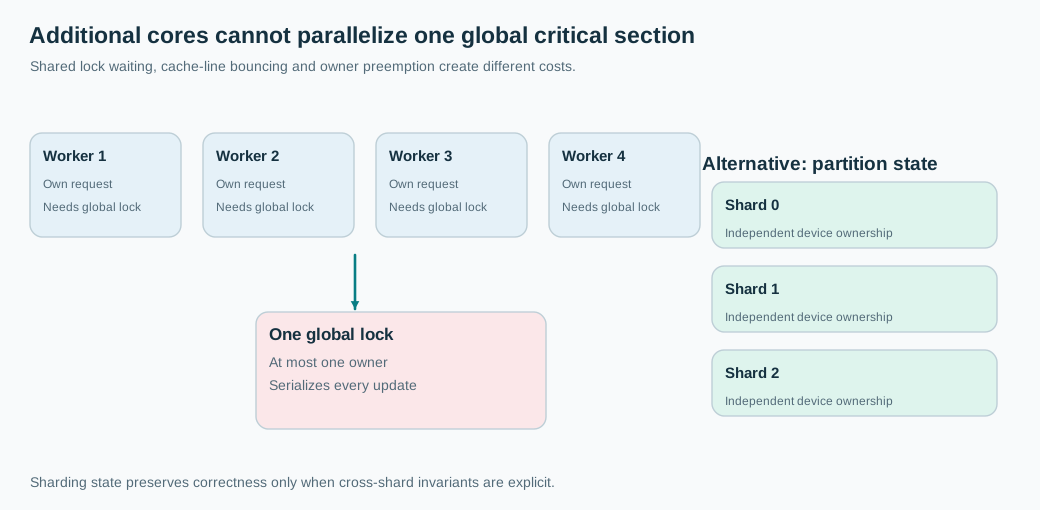
When a lock is free, acquiring it may be a cheap atomic operation. Under contention, an implementation may spin briefly, wait in the kernel, or combine the two approaches. A Linux futex can support efficient blocking when an atomic user-space lock cannot be acquired. The precise behavior depends on the runtime and lock primitive. A Java synchronized monitor, a ReentrantLock, and a native mutex have different implementation details, so do not generalize from one wait profile.
Imagine 64 threads incrementing a shared counter. The cache line containing that counter must move among cores to preserve coherent reads and writes. Even with an atomic increment and no explicit mutex, that line can become a serialization point. A flame graph with a high share in locking, atomic operations, or their callers is more useful than a screenshot that says CPU is 95% busy.
I would compare elapsed time in application computation, runnable waiting, blocked waiting, and lock ownership. On Java, JFR monitor-blocking events and thread profiles can identify hot monitors. On native Linux programs, perf tools can help expose contention, subject to permissions and the instrumented lock type. A lock-wait histogram is often more revealing than an average: a few unlucky requests can wait behind long holders.
A lock owner can also be preempted while it holds a lock. On an overloaded machine, waiters then remain blocked even though the critical section would be short on an idle core. More runnable threads can amplify scheduling delay. This is distinct from an actual deadlock, where no forward progress occurs due to a cycle or unreleased resource.
Find the shared operation, not just the slow line
I want to know what the protected state represents. If the mutex protects the whole device map, but updates to different devices do not depend on each other, its scope is probably too broad. If it protects a global monotonic sequence that all updates must share, partitioning may change the product contract. Those require different designs.
An apparently innocent metrics counter can be the bottleneck. Forty workers successfully handle independent devices, then every request increments the same global statistic. Replacing the data structure while retaining the counter just moves the contention point. A good profile should show which cache lines or lock instances concentrate contention and which callers hold them longest.
One experiment is to fix the thread count at 16 on the new 64-core host. If throughput recovers, uncontrolled concurrency is a clue. Another is to replace the shared counter temporarily with per-thread counters in a nonproduction replay and observe whether lock wait falls. Neither experiment proves the final design, but they isolate the cause much better than a blind heap or thread-pool increase.
Divide ownership along the key that matters
For independent device updates, I would partition state by a stable device identifier into, say, 64 logical shards. Each shard can have one owner or a narrow lock. An update is routed to its owner, where the device-specific changes occur in order. An aggregate across devices can be computed asynchronously or with periodic snapshots, if the product tolerates that delay. This replaces one global contention point with many independent paths.
The nuance is ordering. If updates to the same device arrive through multiple network consumers, each device needs a consistent owner or sequencing rule. Striping locks across hash buckets improves parallelism but only if we preserve the constraints that originally motivated the lock. A lock-free queue or actor model does not magically make shared mutable state safe. Ownership simplifies the correctness argument, but it adds mailbox capacity, migration and hot-device considerations.
Batching is another option. Holding a lock once for a batch of ten updates can reduce acquisition overhead, though it may also increase lock hold time and harm latency. Measure throughput, fairness and p99 rather than assuming a larger batch is always superior.
Check the other possible bottlenecks
If threads are not waiting on locks, compare per-core performance, memory bandwidth, LLC misses and CPU placement. A 64-core machine with multiple NUMA nodes might turn local accesses into remote accesses. Power management and frequency scaling can also change single-thread speed. Those are legitimate alternatives, not excuses to ignore a profile that clearly shows global lock waiting.
My final interview recommendation is to keep the correctness invariant visible while narrowing the serialization domain. The number of cores is not a capacity target. The real capacity limit is the slowest resource that every update must visit.