Skip to content

Every few minutes, p99 jumps by 300 ms. Is it garbage collection?

The Machine Had More Resources. Why Was It Slower? · Part 2 of 6 · 5 min read

Read the worked explanation ↓

Interview question. A Java 21 order API has a stable request rate and median latency near 18 ms. Every few minutes, a slice of requests takes more than 300 ms. Heap usage rises and falls. Walk through a defensible diagnosis, explain what the collector is doing, and propose fixes without blindly doubling the heap.

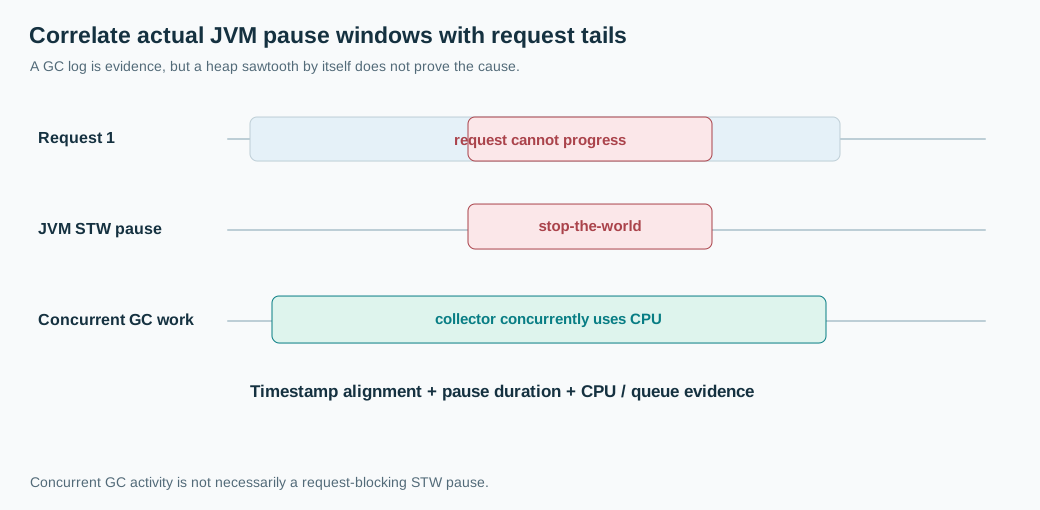
The first thing I want is a timeline. A sawtooth heap graph tells us that memory is being allocated and reclaimed. It does not prove the application stopped for 300 ms. Some collectors perform much of their work concurrently, and some delays that look like GC come from CPU throttling, lock contention, safepoints, or a slow dependency. The latency spikes and GC events must line up at request-level time resolution.

Say a request enters at 12:00:04.200, begins processing almost immediately, then its thread cannot progress between 12:00:04.211 and 12:00:04.480. The access log records 302 ms, but the actual business logic used 33 ms of CPU. We need to know whether those missing milliseconds were a stop-the-world pause, a blocked thread, or a scheduling delay.

A request and JVM event timeline distinguishes actual GC stop-the-world overlap from concurrent collection and unrelated stalls.
Think first

A Java 21 API sees 350 ms p99 spikes, a 90 ms maximum GC pause, 70 ms CPU throttling bursts, and a growing queue of waiting request threads. The team proposes changing G1 to ZGC immediately. Establish a likely chain of causes and design a before-and-after experiment with measurable acceptance criteria.

Take a few minutes to form an approach, then compare it with the worked explanation.

Reveal the worked explanation

Pause time is not all GC time

Java 21 commonly uses G1 by default. G1 divides the heap into regions and collects young objects through evacuation pauses. Portions of its marking work run alongside the application. A pause-time goal is a goal, not a guarantee that every request will satisfy it. Evacuating many live objects, insufficient free regions, remembered-set work, or a costly fallback collection can produce surprising pauses.

Different allocation patterns matter. A large number of short-lived request objects may create frequent young collections. Long-lived caches increase the live set and may raise the amount of work needed to relocate or track objects. A leak can steadily grow live memory until the collector has little room to operate. These are not interchangeable diagnoses, and their fixes differ.

An application that allocates 600 MB each second on a one-gigabyte heap will put heavy pressure on the collector. Yet two workloads with the same allocation rate can behave differently if one retains most objects. I want three measurements: allocation rate, live-data size after collection, and the distribution of actual application pauses. The raw heap-size chart gives only one slice of that story.

Gather evidence without creating another outage

Enable or inspect existing GC unified logs and Java Flight Recorder events, using a short, bounded recording that is appropriate for production. Look for pause types and durations, frequency, heap occupancy before and after, concurrent cycles, allocation hot spots, and safepoint timing. Compare those events to request traces with clocks normalized. A 250 ms GC pause at the same instant as a 300 ms response is meaningful. Five minutes apart is not.

Collect thread dumps or JFR thread-state evidence to exclude blocked database calls and contested monitors. Also inspect container CPU throttling and available memory. GC threads consuming cgroup CPU budget can exacerbate delay. A collector that would complete rapidly on an unconstrained host can struggle when it competes with the application's requests for an undersized quota.

Do not assume a request's reported duration equals the GC pause duration. A request might queue before the pause or behind dozens of others that become runnable at once afterward. The service's p99 can exceed the longest collector pause because of that queueing effect.

Why a bigger heap can make this worse

A bigger heap offers more space between collections, but it can increase the amount of live data examined or relocated when work eventually happens. It can also raise process RSS and press the container into memory reclaim. There is no universal rule that doubling a heap either halves or doubles pause time. The collector, live set, allocation shape, and available CPU determine the outcome.

I'd first eliminate unnecessary allocation from known hot paths. For example, a JSON handler that creates several temporary maps per field may generate far more objects than the representation requires. But avoid speculative object pooling for cheap short-lived objects. Pooling may lengthen lifetimes, increase retained heap, and make concurrent code harder to reason about. Use a profile, not folklore.

If G1's pause distribution remains unsuitable after tuning allocation and memory headroom, compare another collector under the same traffic and hardware. Java 21 provides generational ZGC as an opt-in collector designed for low pause times by doing more work concurrently. That introduces its own memory, CPU, operational and throughput considerations. The fact that a collector advertises low pauses does not absolve the team of measuring throughput and deadline misses.

The reliability decision

A checkout endpoint with a 100 ms deadline may care much more about p99.9 pause overlap than average GC overhead. A nightly report worker may prefer throughput even with occasional longer pauses. That difference should drive collector choice and resource sizing. For the checkout service I would establish a latency budget, measure how many calls overlap pauses, and compare candidates on CPU cost, RSS, sustained throughput, and p99 under load and recovery scenarios.

Finally, check after deployment, not just in a load test. A new cache, changed payload size, or a different live-set composition can change collection behavior without changing QPS. Keep the GC logs, JFR and application tail-latency traces connected enough to answer the next incident in minutes, not hours.
Go deeper

G1 in Java 21 is generational, primarily concurrent, region-based and uses stop-the-world evacuation pauses. Its target pause goal is heuristic. The collector has separate young, mixed, marking and possible fallback phases. When comparing Generational ZGC, verify the exact JVM release and options, and distinguish the concurrent CPU and headroom cost from the reported stop-the-world pauses. Request duration and GC pause are not the same metric because a pause also interacts with run queues and downstream capacity. JFR event availability and sampling overhead should be checked on the deployed JDK build.

Check your reasoning

  • Align the event timeline between request spans and actual GC pauses.
  • Distinguish allocation rate, retained live-set size and STW pause from concurrent work.
  • Evaluate blocked threads, safepoints and CPU quotas as alternative contributors.
  • Profile allocation hot spots and compare collectors in controlled runs.
  • Define accepted p99 and throughput, memory and CPU costs rather than tuning heap blindly.

Common mistake: A sawtooth heap graph proves that the latency spike was caused by a 300 ms stop-the-world pause.

A Java API has a sawtooth heap chart and intermittent latency spikes. Which next step establishes whether GC pauses overlap slow requests?

Read the answer explanation

Measure JVM pause events and request spans with synchronized timestamps — Heap cycles show collection activity, not a proven causal overlap with one request.

Apply it elsewhere

A high-throughput event enrichment worker has no strict interactive deadline, but its memory limit is tight. Decide how you would compare a throughput-oriented GC configuration with a low-pause collector, including the measurements that might reverse your choice.

Compare your approach

Align actual timestamps, identify collector phases, distinguish allocation rate and retained live set, account for cgroup CPU and queues, then defend a workload-dependent collector decision.

One more constraint

Does a rising and falling heap chart establish that a stop-the-world GC pause caused a particular slow request?

Quick revision

A heap sawtooth is not proof of a 300 ms GC stall. Correlate request timelines with Java GC logs and JFR pause events, inspect allocation rate, post-GC live set, safepoints, thread blocking and cgroup throttling. G1 has concurrent work plus stop-the-world phases, and its pause goal is not a guarantee. Reduce proven allocation hot spots and ensure CPU/memory headroom before trying collector changes. Compare options against p99, throughput, RSS and operational cost at the same traffic.

References