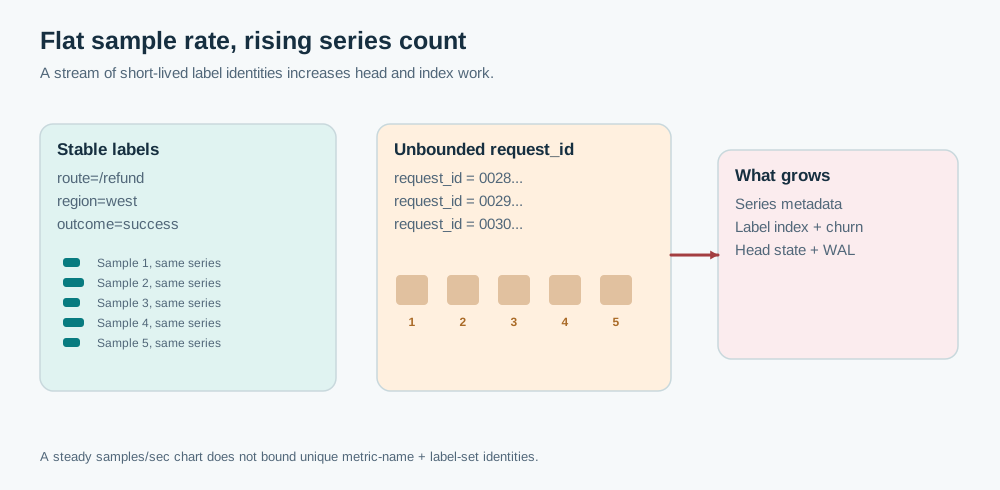
Interview question. A service's scrape volume is steady at roughly 20,000 samples per second. Yet the Prometheus process has doubled its memory consumption in two hours and queries have become sluggish. Deployment traffic has not doubled. A new middleware release started adding a request-specific value to one metric's labels. Explain the failure and design a safeguard that catches it before the next outage.
The first thing I would distrust is the comforting samples-per-second graph. Two workloads can have identical sample rates but radically different active-series counts.
One workload reports a temperature sample every 15 seconds for each of 500 stable hosts. Another reports one sample under a fresh request ID, then never uses that identity again. Both can sustain similar sample throughput. The second continually creates series requiring index and lifecycle bookkeeping. Compression is also less effective when a chunk contains only one or two observations.
Think first
A Kubernetes fleet has 400 scrape targets, 30-second scrapes, and no increase in sample volume. After a rollout, series creations jump from 200 to 30,000 per minute. Walk through the first ten minutes of diagnosis, the emergency stop and the permanent guardrails.
Take a few minutes to form an approach, then compare it with the worked explanation.
Reveal the worked explanation
A sample is not the expensive identity
Prometheus identifies a series by its metric name and full label set. Add request_id="9d4..." and that request occupies a different series from the next request. A head block now encounters new label combinations throughout the day, even if the counter only reports once under each one.
A stable sample rate can hide a growing population of one-sample series and rising head-index cost.
Consider a simpler static metric. It has 20 routes, 4 outcomes, 10 regions and 12 pods. At most 9,600 combinations exist under those particular values, with fewer if some combinations never occur. That is a plausible bounded metric family. Put a fresh request ID on every observation and the useful bound disappears. The series population now follows unique requests, not operational dimensions.
The in-memory cost is not a universal fixed number of bytes per series. It depends on labels, the index, chunks, allocator behavior and the implementation version. Older inactive series also do not immediately vanish just because the latest scrape no longer includes them. Prometheus keeps recent samples in its head and writes a WAL for recovery. You cannot infer recovery memory and disk requirements from the compressed size of finished blocks. Prometheus storage
I would inspect head-series count, creations, memory, WAL growth and cardinality by label. I would compare those with the release time. Then inspect the middleware output, not only the dashboards. If the new label's values look like UUIDs, URLs with identifiers, user IDs or timestamps, we have a likely cause.
Cardinality and churn are related but not identical
A metric can have a million stable series, which is expensive but somewhat predictable. It can also create 50,000 new identities every minute and retire old ones. The second has a high series-churn rate. The backend has to keep processing new label identities and index entries even if the number of currently scraped targets appears stable.
This matters in container fleets too. A pod_id label may be appropriate for some operational views, but constant rollouts replace one collection of label identities with another. Some churn is normal. A request ID in a metric label is different because it is unbounded by design.
One danger is proposing a hard drop at the ingestion gateway and assuming the incident is over. Dropping the bad metric stops new pressure, but previously created series and WAL content may continue to occupy resources until they age out or the storage engine performs its normal cleanup. Restarting a memory-constrained TSDB without understanding WAL replay can turn a degraded service into a prolonged outage.
Put the first guard near the producer
I would first remove the request ID from metrics and expose a route template, bounded error category and region instead. If engineers need to connect a graph spike to one request, attach a trace exemplar where supported, or emit a structured event that can be searched by request ID. Don't sacrifice investigative data. Put it in a system built to retrieve individual events.
Then enforce a label policy in instrumentation reviews. Treat unbounded dimensions as a correctness risk, not just a cost smell. OpenTelemetry metrics SDKs can enforce cardinality limits and aggregate excess attribute combinations into an overflow point. This protects memory at the instrumentation boundary but changes what grouped queries can see. Make overflow visible. OpenTelemetry cardinality limits
On the collector or receiver side, set per-tenant and per-metric limits appropriate to the chosen backend. A limit that rejects a whole scrape or write request creates different failure behavior from dropping one label. Measure how your stack behaves, including whether aggregate totals remain complete. Do not promise a generic “cardinality cap” is free of missing data.
I would alert on the growth rate of series, not merely the absolute count. A fast increase is a better early warning than a RAM threshold that trips when the box is nearly exhausted. Break it down by team, service and metric so the producer can be identified without blocking every tenant.
Verify that the repair changes the failure mode
Replay a realistic instrumentation load in staging. Hold samples per second constant while changing the number of unique label sets. Watch head memory and WAL behavior rather than just throughput. Next, exercise churn under repeated deployments and confirm the overflow/rejection path has telemetry of its own.
During a real incident I would protect query and ingestion availability separately. Expensive dashboard queries may need limits while the head settles. A local Prometheus server is not itself a replicated cluster. Long-term remote storage and local WAL recovery have different operational failure boundaries.
The interview answer is therefore not “add RAM” or “increase retention.” Explain the identity count, find the unbounded dimension, stop creating new series, expose safe bounded metrics and searchable events, then verify that both producer-level and backend-level limits degrade visibly instead of silently corrupting dashboards.
Go deeper
Cardinality is the count of observed label combinations. Churn measures how quickly identities are created and become inactive. A high rate of transient identities can be costly even when current-series dashboards look stable. Estimate both active_series and new_series/minute, along with bytes of WAL, chunk population, series metadata, and number of label values per metric. Avoid assuming memory / series is constant across label shapes or server versions.
Sampling metric observations after unbounded labels have created aggregation state may fail to control cardinality. In contrast, dropping the identity dimension before aggregation usually changes the shape of the workload. If events must retain the ID, move them to a different signal with an explicit privacy and retention policy.
Check your reasoning
Separate sample rate from number of series identities and creation rate.
Measure cardinality by label, head memory, WAL growth and series churn.
Find unbounded labels in the producer before trying larger disks.
Explain cleanup lag and hazards of restarting under WAL replay pressure.
Distinguish SDK overflow from backend rejection and preserve necessary events.
Common mistake: A flat samples-per-second chart rules out cardinality-driven memory growth.
Read the answer explanation
Remove unbounded labels, monitor series creation, and apply observable SDK/backend limits — Creating new label combinations increases series state, index work and WAL pressure even if the total sample rate is unchanged.
Apply it elsewhere
A feature-flag service adds `experiment_id` to a metric. Experiments are bounded per month, but user-specific experiment assignments are not. Decide which dimensions belong in metrics, which belong in events and how to detect accidental growth.
Compare your approach
Explain series identity versus sample volume, head-index and WAL costs, churn, delayed cleanup, safe mitigation ordering, producer label normalization and backend quotas. State that rejection and overflow have different data semantics and verify that their effects are observable.
One more constraint
An engineer says the samples-per-second graph is flat, so the TSDB cannot be suffering a cardinality problem. What evidence would disprove that claim?
Quick revision
Memory can climb at a steady sample rate because each unique metric name and label combination creates a distinct series. A request ID or raw URL path turns observations into a stream of one-off identities, increasing head state, index work and WAL load while hurting compression. Diagnose new-series rate, cardinality by label, memory and WAL, then remove unbounded labels near the producer. Use events or traces for individual IDs. Add visible SDK and backend budgets, and don't assume the old series disappear instantly after the fix. The follow-up is what you do if the safeguard drops telemetry that an incident investigation actually needs.