Interview question. A payments service handles 40 million requests a day. Its dashboard tracks latency and error rate by route, status and region. Support now wants to search by order ID and reconstruct exactly why one customer's refund was rejected. The team proposes adding order_id and customer_id to every Prometheus metric. Would you approve that change, and what would you store instead?
Capacity, Isolation & Operations · Staff
One refund failed. Why can't the metrics dashboard find that request?
The Numbers Were There. The Answers Weren't. · Part 1 of 6 · 6 min read
Read the worked explanation ↓Think first
A ride-sharing service serves 5,000 requests per second. Product asks to chart error rate by trip ID and to let an on-call engineer find the full path of a specific failed payment. Design the signals, their attributes, query paths, sampling policy and retention boundaries. Which data must never be sampled?
Take a few minutes to form an approach, then compare it with the worked explanation.
Reveal the worked explanation
There are two kinds of question hiding inside this request
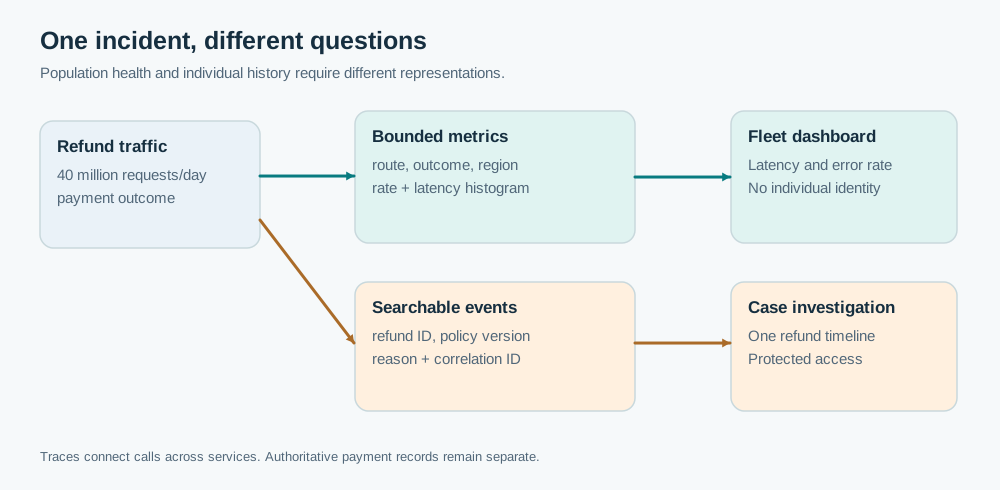
First, the operational question: are refunds slower, which region fails, and did the release change errors? You can answer those by counting requests and summarizing durations across well-chosen dimensions. You rarely need to remember each individual HTTP request to calculate that picture.
The second is investigative: what happened to refund R-4826, which policy version evaluated it, and which downstream call failed? This question needs a particular execution history. A time series labelled only by route=/refund, status=409 and region=west cannot reconstruct that history. It was never designed to.
Metrics and events are not two databases containing the same information in different formats. They are different representations with different information loss. Aggregation makes metrics cheap to query at scale precisely because it discards much of the identity of individual operations.
Imagine that one latency metric uses 60 route templates, 5 status classes and 4 regions. Those dimensions permit 1,200 combinations, although only combinations actually observed become series. If somebody adds 500,000 distinct customer IDs, the potential combinations balloon to 600 million. They won't all necessarily appear, but it is now possible for traffic to create an enormous number of distinct series without increasing the request rate.
The important cost in a typical labelled metrics store is not simply the number of samples. Each unique identity needs associated index and active-series state. OpenTelemetry's metrics model also maintains aggregation state per attribute combination. The problem appears before long-term disk retention becomes interesting. OpenTelemetry metrics and Prometheus label guidance explain the underlying choices.
I would keep the metrics deliberately boring
For this service, I would instrument a request counter, an in-flight request gauge if needed, and a duration histogram. The labels might be route template, outcome class, region, and a bounded error category. They must be finite, useful dimensions that engineers actually group or filter by. A URL such as /refund/R-4826 should be normalized to /refund/{refundId} before it becomes a route label.
The metric answers whether the system is healthy. A count grouped by error category can show that POLICY_REJECTED increased after deployment. A latency histogram supports questions about tail behaviour that an average duration cannot answer. Histograms have their own cardinality and resolution costs, so I would not create dozens of arbitrary label dimensions for them either.
Now create a structured event for the individual decision. A useful event might contain the refund ID, an event timestamp, the decision outcome, the policy version, a correlation ID, and a restricted diagnostic reason. Keep sensitive customer data out of the payload unless retention, access control and privacy policy justify it. The event store needs a way to retrieve the specific refund history, perhaps an index by refund ID and time. It may be a log/search store or an operational event table, not necessarily a metrics TSDB.
The event pipeline has different costs. At 40 million events per day and an assumed 500 bytes of logical payload per event, that's about 20 GB per day before indexes, replication, compression and storage overhead. We should size those separately, rather than pretending events are free because they did not multiply metric labels.
Where traces help, and where they don't
Distributed traces answer a third variation of the question: which services and spans did this request pass through, and where was time spent? A trace ID can connect the refund event to the authorization service, fraud policy evaluator and ledger call. A trace may be sampled, however. Head sampling can omit rare failures. Tail sampling can retain interesting traces after seeing their outcome, but it introduces buffering, routing and sampling-policy complexity. Sampling is not a substitute for an authoritative audit record.
If compliance requires proving why a refund was denied, I would persist the decision event independently of tracing and define its delivery and retention guarantees. If the team only needs representative latency breakdowns, sampling traces is reasonable. If product needs a real-time count of all denied refunds, use a metric or a properly maintained aggregation, not a count of sampled traces.
This is also a useful place to separate observability from product data. A customer-facing refund history has its own correctness contract and access controls. Do not make the metrics backend the only source of a business decision that somebody may challenge later.
What I would ask before choosing a store
I would ask support to show three actual investigative queries. Is it refundId = x? Is it all failures for a policy version over a day? Is it a free-text search through rejection details? Each favors different indexes and retention choices. I would also ask the security team who may retrieve events and for how long. Search does not justify indefinite retention.
Finally, connect the signals carefully. The metric should point the engineer toward the failure category. An exemplar or correlated event may lead to one trace. The event reveals the individual decision. The authoritative payments database determines the current refund state. Each tool answers what it knows.
For the interview, my design is not “use Prometheus plus Elasticsearch” by default. It is: use bounded, pre-aggregated metrics for population questions, searchable events for individual history, and traces for execution paths. Choose concrete systems only after the query, volume, privacy, and durability contracts are clear.
Go deeper
A metric label is a dimension within a metric identity. Adding unique IDs is costly even if the metric's sample rate stays fixed, because new label combinations create new time series. A cardinality limit at the SDK may collapse overflow combinations into a synthetic series. That protects memory but removes the ability to filter by those individual identifiers. It should be observable as a loss of dimensional detail, not silently presented as perfect coverage.
If a product requires arbitrary filtering over high-cardinality events, evaluate indexes, columnar/event storage, data retention tiers, tenant isolation, ingestion bursts, and access controls. A metrics backend with sufficient hardware can support substantial cardinality, but hardware does not undo the difference between aggregated signals and individual evidence. For regulated events, validate durable acceptance and audit completeness separately from observability pipeline availability.
Check your reasoning
- State at least three actual observability questions and classify their required evidence.
- Show how adding user/order IDs multiplies series identities even with unchanged request rate.
- Choose bounded metrics, searchable structured events and correlated traces with distinct retention contracts.
- Explain trace sampling and why audit-critical business events need independent durability.
- Address access control and privacy of identifying fields.
Common mistake: Adding a customer ID as a metric label gives an inexpensive searchable event log.
Read the answer explanation
Use bounded metric labels, preserve individually searchable decisions as controlled events, and correlate traces — Population metrics are efficient because they aggregate identities. Structured events retain the detail needed for a specific refund, while tracing explains the cross-service path.
Apply it elsewhere
A coding agent platform wants dashboards for tool failures and a searchable record of every filesystem modification made by an agent. Choose a metrics contract, a trace contract, and an authoritative change-event contract. Explain what each consumer can prove.
Compare your approach
A strong answer separates population metrics, individual events, sampled traces and authoritative business records. It quantifies label cardinality, addresses access control and retention, explains why an overflow aggregate cannot recover lost identities, and states which evidence must survive sampling and outages.
One more constraint
A metrics SDK limits series cardinality and folds extra attribute combinations into an overflow series. Has the team solved the individual-trip investigation requirement?
Quick revision
Metrics are for aggregated questions such as error rate by bounded route, outcome and region. Each distinct label set creates a series, so an order ID or request ID belongs in an event or trace rather than in a metric label. Searchable structured events preserve individual decision evidence, while traces explain the cross-service path and may be sampled. Keep compliance-critical events and product state outside a best-effort observability pipeline. In an interview I would first state the exact queries, then select each signal and its retention and privacy contract. The changed-condition question is whether the team can still investigate a specific failed order when tracing is deliberately sampled.
References
- Signals and observability · OpenTelemetry
- Metrics SDK model and cardinality · OpenTelemetry
- Metric and label naming · Prometheus