The interview question. A prepared reporting query filters orders by merchant_id and a date range. Most merchants have a few hundred orders. One enterprise merchant has four million. After a deployment, small merchants are fast, but the enterprise merchant takes seconds. The same SQL and indexes are used for everyone. A diagnostic run with a value-specific plan is fast for the large merchant. Investigate why the application is using a worse plan and decide what to change.
Assume PostgreSQL with server-side prepared statements. No index is corrupt. More rows can legitimately mean greater latency. The distinguishing fact is that a different execution plan processes its workload materially better under comparable conditions.
Think first
A multi-tenant analytics API uses a server-side prepared SELECT with org_id = $1. Most orgs have fewer than 500 matching rows, but the top two have millions. The top tenants became much slower after the driver began preparing SQL server-side. Describe the investigation, how you would prove or reject a generic-plan issue, and a safe remediation.
Take a few minutes to form an approach, then compare it with the worked explanation.
Reveal the worked explanation
The optimizer is choosing before it knows the full work
The database estimates row counts, compares access paths and join methods, and chooses a plan. In an ideal world, the estimate would reflect this merchant and this date range. In real systems, statistics are samples and workload distributions are uneven.
An illustrative query might look like this:
PREPARE recent_orders(bigint, timestamptz) AS
SELECT id, created_at, total_cents
FROM orders
WHERE merchant_id = $1 AND created_at >= $2;
For a small merchant, an index on (merchant_id, created_at) might find a few rows and fetch their values efficiently. For the largest merchant, the same index may identify an enormous fraction of the table's relevant pages. A different scan strategy, or a plan suited to a partition containing that merchant, can have much lower total cost. The same SQL does not imply the same optimal access path.
The interesting failure is not the large merchant having more data. It is the application sometimes losing the chance to choose a plan with that merchant's values in mind.
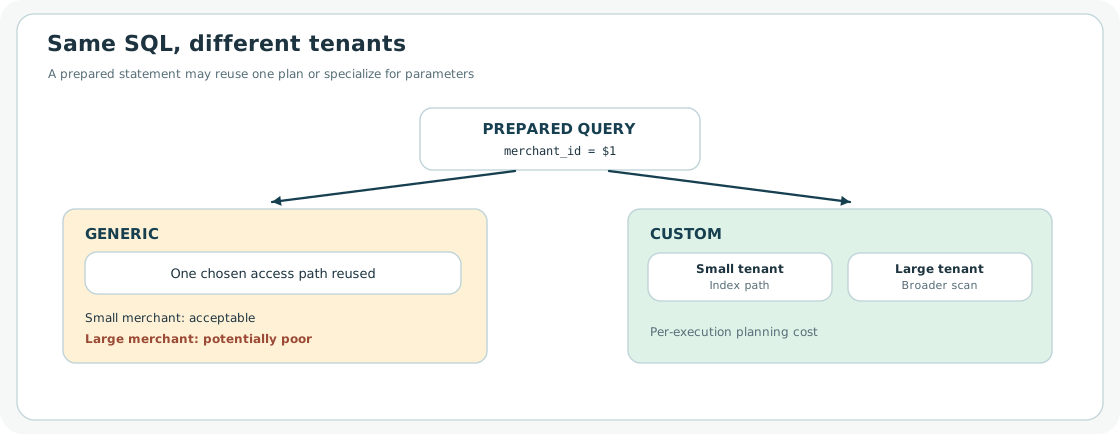
A generic prepared plan is reused for small and large merchants, whereas parameter-specific plans can choose different access paths
Prepared statements have a decision of their own
PostgreSQL can use a custom plan, generated with the current parameter values, or a generic plan, reused without specializing to those values. The generic choice avoids repeated planning work. For a fairly uniform workload, that is often good. For heavily skewed merchants, one reusable plan may be a poor fit for a minority of executions.
The rules are more specific than “prepared statements are always generic.” In PostgreSQL 18's default plan_cache_mode=auto, the first five executions of a parameterized prepared statement use custom plans. PostgreSQL then compares a generic plan's estimated cost with the average estimated custom-plan cost to decide whether reuse is attractive. This is a heuristic, not a guarantee that it chooses the fastest real execution for every merchant. See the PREPARE documentation.
A production application's use of server-side preparation also depends on its driver settings, pooling behavior, and connection lifetime. I would first establish that the slow query actually reached the server in the prepared form being investigated. Otherwise we could spend a day blaming a plan cache the application never used.
Reproduce the plan difference, don't guess it
I would compare representative merchant IDs while keeping the same date window, database statistics, and amount of data returned. For a real prepared statement, EXPLAIN EXECUTE exposes the plan chosen for that execution:
Use a safe environment if the result is expensive. Check whether the plan is generic or custom, and compare predicted rows with actual rows. A node estimated at 300 rows but emitting 3 million has a cardinality problem that can poison subsequent decisions. A node estimated accurately but still taking a long time may instead be doing necessarily expensive work. The EXPLAIN guide distinguishes estimated plan cost from observed execution timing.
For diagnosis in a controlled session, compare plan_cache_mode=force_custom_plan and force_generic_plan. If the large merchant's plan changes and its execution improves with a custom plan, we have evidence for parameter-sensitive selection. Those settings are useful experiments, not permission to force one plan policy globally before understanding planning overhead and the ordinary merchant mix.
Then inspect the data distribution. PostgreSQL's pg_stats tracks approximate distinct counts, common values, and histograms. A tenant key with a few enormous values may require a larger statistics target to represent its skew accurately. Where multiple predicates are correlated, extended statistics such as multivariate most-common-value lists may help estimation. They do not automatically solve all joins or parameter-sensitive behavior. The statistics documentation describes both the capabilities and limits.
Three fixes that solve different problems
First, if the planner is making a bad decision because it has poor information, improve appropriate statistics and run ANALYZE, then remeasure. This helps bad statistics, not a fundamentally unsuitable access path.
Second, if a generic plan is inappropriate for a small class of skewed parameters, selectively use custom planning for that query or construct a separate supported query path. A two-millisecond planning cost may be justified if it saves seconds of execution for enterprise merchants. It may be wasteful across millions of cheap small-merchant calls. The tradeoff is planning CPU versus execution cost, measured at fleet scale.
Third, if the large merchant genuinely dominates writes, storage and reporting, isolate the workload or adjust its physical organization. That could mean a dedicated reporting projection, partitioning policy, or a targeted export path. Changing plan_cache_mode does not make a scan of four million rows cheap, and splitting tenants is an architectural decision with its own cost.
A good Staff answer ends with an experiment and an ownership decision. Which query shapes are affected? What plan was used? What did the estimates miss? Who will monitor regressions after the correction? The underlying engineering skill is learning to distrust a plausible plan without assuming the optimizer is foolish.
The reporting team fixes the plan. Its next query joins order headers with order items. The plan is sensible, but the runtime changes sharply when the input becomes larger. Why does the join suddenly start writing temporary files?
Go deeper
Plan reuse details and traps
A generic plan may show parameter placeholders such as $1, while a custom plan can show substituted parameter values. A prepared plan can be invalidated or replanned when referenced definitions or planner statistics change, so never assume reuse is permanent. Reproductions need the actual prepare/execute lifecycle rather than a freshly parsed SQL string that always sees constants.
A single-column histogram does not express every relationship between merchant_id, status, and created_at. Extended statistics are collected only for specified column groups and have documented restrictions. More precise statistics can increase planning work and ANALYZE cost. Inspect what it improves rather than blanket-increasing every target.
If the query is behind a transaction-pooling proxy, verify whether server-side prepared statements and session state behave as expected in that configuration. Drivers can also switch to server-side preparation only after a usage threshold. These operational details can explain why an issue appears only after a deployment or a change in connection behavior.
Check your reasoning
Verify actual server-side preparation and the application connection and driver behavior.
Compare generic and custom execution plans for representative parameters with controlled EXPLAIN EXECUTE.
Inspect estimated versus actual rows, MCV statistics, correlation, and realistic output size.
Explain planning-overhead tradeoffs of custom plans and avoid changing global defaults prematurely.
Distinguish a bad plan from legitimately high work and propose workload isolation if necessary.
Common mistake: Claiming all prepared statements are generic, or that ANALYZE must always fix enterprise-tenant skew.
Read the answer explanation
Compare EXPLAIN EXECUTE under forced custom and generic planning in a controlled session. — A controlled custom-versus-generic comparison tests the hypothesized plan reuse before a fleet-wide setting is changed.
Apply it elsewhere
A public API has one giant customer whose request pattern differs from everyone else. Its prepared query sometimes chooses a plan optimized for typical customers. What data and tests do you need before creating a giant-customer code path?
Compare your approach
Prove the plan difference with actual parameterized query execution, study cardinality and workload costs, and compare a targeted exception to general planning and storage changes.
One more constraint
The custom plan is faster for 0.1 percent of calls. How do you decide whether its extra planning cost is acceptable for the other 99.9 percent?
Quick revision
I would first prove the application is using a server-side prepared statement, then compare EXPLAIN EXECUTE for small and large merchants. PostgreSQL may choose a generic reusable plan instead of a parameter-specific custom plan, and extreme tenant skew can make that reusable choice poor. I would compare estimated versus actual rows, test forced custom and generic plans in a controlled session, inspect statistics and correlation, and measure planning overhead before changing anything globally. If the enterprise tenant is simply too large for the existing layout, a better plan alone will not solve the capacity problem.