The interview question. A reporting service joins orders to order_items for the last 30 days. The query plan uses a hash join. With a smaller date range it finishes quickly. At the new range it writes several gigabytes of temporary data, and concurrent reports drive disk latency through the roof. Explain where a hash join spends memory, how spilling changes its execution, and how you would fix the workload without causing an out-of-memory incident.
Assume PostgreSQL, a correct join key, and no missing join condition producing an accidental Cartesian product. The input has genuinely grown. Unlike the previous lesson, we will not need a bad cached plan to explain this failure. A reasonable join strategy can run into a physical resource limit.
Think first
A SQL report joins 60 million device readings to 4 million devices. Its hash join suddenly uses eight batches and writes 24 GB of temporary files. The database has 128 GB RAM but 80 concurrent reporting connections. Explain the spike, diagnose the plan, and propose capacity-safe options beyond increasing memory globally.
Take a few minutes to form an approach, then compare it with the worked explanation.
Reveal the worked explanation
What the hash join actually builds
Think of joining recent orders to their items:
SELECT o.merchant_id, SUM(i.quantity)
FROM orders o
JOIN order_items i ON i.order_id = o.id
WHERE o.created_at >= :cutoff
GROUP BY o.merchant_id;
A typical hash join chooses one input to build a hash table, often the smaller one. For each build-side row, it hashes the join key and retains the data needed for matching. Then it scans the probe side, hashes each probe key, and finds matching rows in memory. When the build data fits, the join avoids repeated full scans or individual index lookups for every matching row.
The hash table is not the final grouped result. It is an intermediate structure that makes matching rows cheap. Its real memory need includes hash buckets, pointers, row data, alignment, and executor overhead. Counting only the raw join keys produces an unrealistically small capacity estimate.
A sort, an aggregation, another hash table, and multiple sessions can all hold memory simultaneously. That makes “the server has 128 GB of RAM” a poor reason to grant any one join 100 GB.
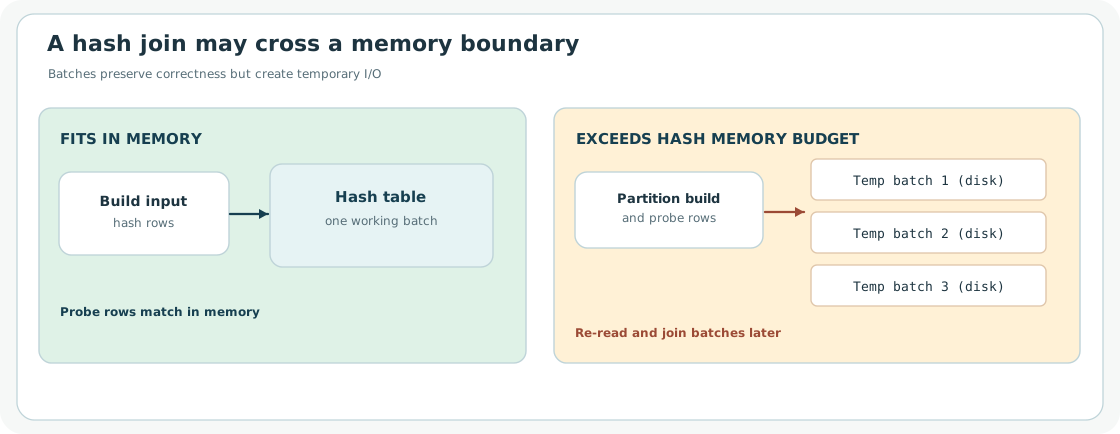
An in-memory hash join uses one build table, but when the table exceeds its budget it partitions inputs into on-disk batches that are processed later
The threshold is not a switch from correct to incorrect
When the build-side hash table cannot stay within its memory budget, the executor can split the work into batches. The working batch is handled in memory, while other partitions of build and probe rows are written to temporary storage and revisited. Rows still match correctly. The cost changes because the query does extra writes, reads, bookkeeping, and sometimes repeated partitioning when skew defeats an even distribution.
That explains the sharp performance change. The report may be doing only twice as much logical work but many times as much physical I/O. If ten such reports spill simultaneously, they can interfere with each other, with the database's regular workload, and with background maintenance. This is an overload problem caused by query execution, not a broker or API retry problem.
In PostgreSQL, the Hash node in EXPLAIN ANALYZE reports buckets, batches, and peak memory usage. A hash operation with multiple batches is an important signal of partitioned work. BUFFERS can show temporary block reads and writes. Check the whole plan, because a separate Sort or aggregation can spill independently. PostgreSQL describes these fields in its EXPLAIN documentation.
Measure before increasing memory
Suppose work_mem is 16 MB and hash_mem_multiplier is 2. Under that configuration, the nominal hash-operation budget is about 32 MB. Those are illustrative settings, not a recommendation. PostgreSQL calculates hash memory limits from these two parameters, while sorts and other memory-consuming nodes have their own allocations. The resource configuration guide warns that a query can contain several such nodes and that concurrent sessions multiply the total demand.
A naive fix is to set work_mem to 1 GB globally. Now consider 100 concurrent reports, each with multiple memory-consuming operators. We have traded temp-file pressure for a plausible memory-exhaustion failure. The correct budget depends on query concurrency, operator counts, available memory, and what else must stay healthy.
I would record three things under representative load: the build and probe input sizes, the number of hash batches and temporary bytes, and the concurrent query count. Then examine whether the filter on orders.created_at is applied early, whether columns can be projected away before the join, and whether the query aggregates detail rows far later than necessary. Reducing the material fed to a join is usually more robust than allowing the same expensive shape to consume unlimited memory.
Choose a different join only for a reason
Hash join is not the only option. A nested-loop join with an indexed inner lookup can be excellent when the outer side is small. It can be terrible when millions of outer rows each demand a separate lookup. A merge join can take advantage of already sorted inputs, but sorting unsorted inputs also costs time and memory. The best choice follows the workload and access paths, not a ranking of join algorithms from fastest to slowest.
For this report, I would also consider a pre-aggregated daily order-items projection if the product needs repeated summaries rather than every raw line. The projection requires its own freshness and correction contract. It cannot simply be declared equivalent to the original query if orders can change or refunds revise earlier totals.
If a small number of reports causes the damage, constrain reporting concurrency or move it to isolated resources. Admission control is important even after an optimized query is shipped, because users can request larger windows later. A working query plan is not a capacity guarantee.
The interview discussion should establish the operator's memory model, show why crossing that budget changes I/O, and pick a fix based on evidence. “Add more RAM” can be one evaluated option, but it is not the explanation.
The team gets the join back under control. A different endpoint now uses a covering index and promises not to read the table at all. Its plan says Index Only Scan, yet heap reads remain high. What is still missing from the index?
Go deeper
A short mental model of memory multiplication
In PostgreSQL, work_mem is approximately a per-operation allowance, not a cluster-wide pool. A plan with two sorts and a hash does not share one universal allocation. Parallel workers and many active sessions add further demands. Raising the limit for one isolated reporting job can be defensible, but its safe value cannot be inferred from the memory size of one host without considering the concurrency policy.
Hash skew matters too. If one join key occurs millions of times, a partitioned hash join may still have an oversized hot partition. Investigate key frequency and whether the business query requires all duplicates. Pre-aggregation might shrink the build input, but only if aggregation preserves the join's meaning. If the report joins unrelated tables at the wrong grain, extra memory merely masks a cardinality explosion.
When comparing algorithms, collect observed time, buffer activity, temp I/O, rows emitted per node, and output correctness. Temporary files are symptoms of the physical plan. The remedy may be earlier filtering, improved grouping, a different join method, a materialized projection, targeted memory, or workload isolation.
Check your reasoning
Explain build and probe sides and hash table memory rather than merely naming hash join.
Describe partitioned batches and temporary reads and writes when build input exceeds its hash budget.
Use actual Hash batches, temp buffers, and query concurrency to establish the physical bottleneck.
Distinguish targeted work_mem tuning from dangerous per-operation and per-session multiplication.
Evaluate earlier filtering, pre-aggregation, alternative join strategies, and report concurrency limits.
Common mistake: Claiming that a hash join remains memory-only because the server has plenty of total RAM.
Read the answer explanation
The executor partitioned work because the hash build did not fit the chosen in-memory budget. — Multi-batch hash execution commonly indicates spill or partitioned work when the hash table exceeds memory budget. Investigate the full plan and temp I/O.
Apply it elsewhere
A data warehouse joins a large clickstream to a customer dimension. One customer has half the clicks. What additional risk can remain after simply raising join memory?
The hash now fits with 1 GB work_mem, but 50 reports run concurrently. What could fail next?
Quick revision
A hash join builds an in-memory table for one input and probes it with the other. If the build data exceeds the hash memory budget, the executor can partition work into batches and spill rows to temporary files. That adds I/O and may create severe contention when many reports run together. I would inspect EXPLAIN (ANALYZE, BUFFERS), especially the Hash node's batches, memory, and temp activity. Then I would reduce join input, evaluate alternative join paths or a pre-aggregation, and control reporting concurrency. Raising work_mem globally is unsafe because its allocation can be multiplied across operators and sessions.