Your telemetry backend disappears for twenty minutes during a regional outage. Collectors have 2 GB free each and incoming compressed telemetry averages 3 MB/s per collector. Calculate the approximate buffering limit and explain what you prioritize when capacity runs out.
Reliability & Failure Recovery · Principal
The outage began. Why did every graph stop updating at the same time?
The Dashboard Was Green. The System Was Not. · Part 5 of 6 · 5 min read
Read the worked explanation ↓Think first
Your telemetry backend disappears for twenty minutes during a regional outage. Collectors have 2 GB free each and incoming compressed telemetry averages 3 MB/s per collector. Calculate the approximate buffering limit and explain what you prioritize when capacity runs out.
Take a few minutes to form an approach, then compare it with the worked explanation.
Check the exercise numbers
Using decimal units and assuming the stated 3 MB/s is the actual stored-byte rate, 2 GB / 3 MB/s is about 667 seconds, or 11 minutes 7 seconds. Twenty minutes requires 3.6 GB, so the 2 GB buffer falls short by about 1.6 GB before metadata, headroom and retries. If queue serialization differs from incoming compression, measure its stored expansion and usable queue capacity instead. Bound lower-priority diagnostic loss, report the gap, and preserve mandatory audit evidence through its separate delivery contract.
Reveal the worked explanation
Interview question. During a partial database failure, the metrics backend stops accepting samples and several tracing collectors become unavailable. Application requests are still flowing, but the dashboards show no recent points. Design an observability system that provides enough evidence during the failure without making the production service depend on its telemetry stack.
There is a particularly nasty version of an incident where the first symptom is silence. The checkout error graph looks almost serene. The log search tool still returns results from ten minutes ago. A developer says the cluster seems healthy because there's no new alert. The problem is that our measurement system has stopped reporting. A missing measurement is not a zero measurement, and a query returning nothing is not evidence that customers are fine.
I'd first separate the observed service from the observation system. The checkout process should not synchronously block every customer request waiting for a metrics collector. Normally telemetry export is bounded and asynchronous, with timeouts, batching and an explicit resource budget. Otherwise a tracing outage can turn an otherwise healthy service into an application outage. The tradeoff is unavoidable: if exporters are allowed to drop telemetry to protect customer traffic, we need to detect and communicate when we have lost visibility.
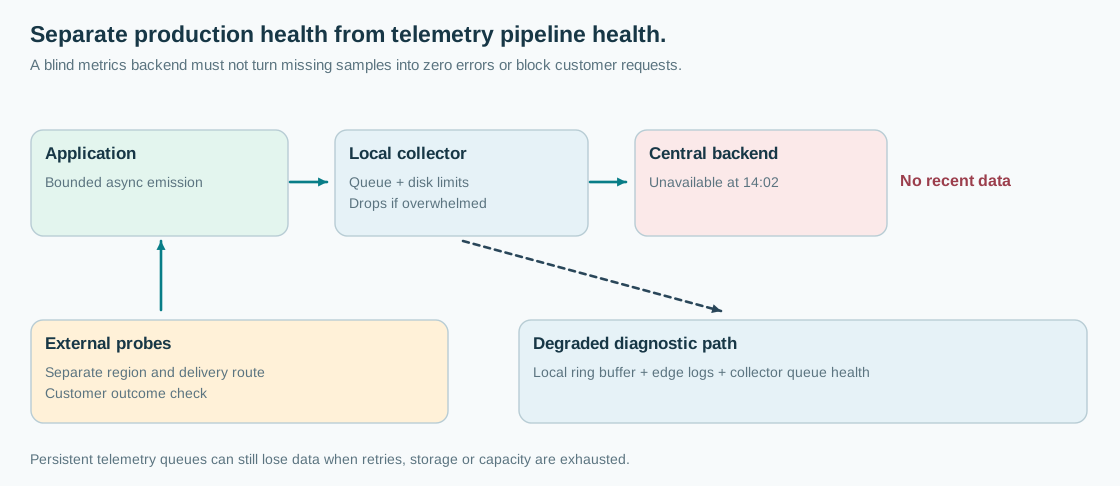
Draw the paths. Applications emit counters and spans to node or sidecar collectors. Collectors buffer, retry and export to central storage. Dashboards query that storage. Separately, an external synthetic probe places a small safe checkout request through the public edge and records whether it reaches an expected terminal state. Another health channel checks telemetry freshness itself. The probe must not share all of the application's critical dependencies, or it may disappear with exactly the system we're trying to watch. Independence is a matter of failure domains, not simply using two different dashboard URLs.
During the incident, ask three questions before changing anything. Is the service failing? Is telemetry failing? Are both failing because of a common dependency such as the same regional network? Compare customer support reports, edge access logs, synthetic results, load-balancer counters and any locally retained service metrics. A collector ingestion graph may look healthy up to 14:02 and then stop. Its last timestamp, queue occupancy, rejected exports and exporter retry errors are first-class health signals. A display must distinguish stale data from a real measurement of zero. Put the sample timestamp and reporting delay beside the value.
Consider the collector's local queue. An in-memory sending queue with finite capacity can absorb a short exporter outage. When that queue fills, records may be dropped. Persistent storage can survive a collector restart, but it has finite disk space and can fail independently. Retry settings can stop attempting old records after their time budget expires. OpenTelemetry Collector resilience documentation explicitly discusses these loss cases. "We enabled retries" is not the same promise as "we have a durable record of every failure." If the business requires stronger evidence, choose an appropriately operated durable log for selected audit events rather than pretending sampled traces are an audit ledger.
We also need to avoid feedback loops. If log exporters fail and agents retry indefinitely, they can saturate disk or network while the database is already struggling. Put ceilings on telemetry CPU, memory, disk, queue depth and export bandwidth. Prefer dropping low-priority debug spans before essential production resources are exhausted. If telemetry is regulated audit evidence, handle it with a separately designed delivery contract and failure policy, not the same lossy path as best-effort debugging events.
What about a central service outage lasting fifteen minutes? The protected collector queue could restore some missing samples when the backend returns. But there may still be gaps because application SDKs sampled before export, the collector ran out of capacity, or the persistence layer failed. Backfill can produce strange-looking graph spikes if you mistake ingestion timestamps for event timestamps. Keep those notions separate, and ensure alert evaluators understand gaps. A sample recorded at 14:03 and uploaded at 14:19 describes 14:03 if the metric semantics support it.
I'd create a minimum degraded-diagnostics kit: safe external probes from more than one region, a recent local ring buffer of structured logs, node-level load and process stats reachable by a break-glass path, deployment history, and request IDs visible from the edge. These tools should work when the preferred tracing backend is unavailable. Do not turn the fallback into an uncontrolled sensitive-data dump. Limit retention, access and cardinality, and test the break-glass credentials before you need them.
A Principal-level design review would ask whether two telemetry backends genuinely provide independent evidence. If they both read from the same collector fleet, the same identity provider, or the same regional control plane, they may fail together. Where failure independence matters, separate enough collectors, storage and alert delivery to preserve an emergency signal. You don't need to duplicate every costly trace forever. You need a path that tells you your normal path is blind and a way to inspect high-value facts safely.
Finally, rehearse this incident deliberately. Disconnect the exporter while a test workload generates a known rate of events. Measure queue fill, lost observations, the time before a stale-data alert fires, whether customer latency changes, and the backfill behavior after reconnect. If the dashboard stays green through that test, the correct remediation is to fix the monitoring semantics before trusting the dashboard again.
Go deeper
The OpenTelemetry Collector commonly supports an exporter sending queue, retry behavior and persistent storage through the file storage extension. Their protection is bounded by queue and disk capacity, configuration, shutdown behavior, failure duration and telemetry already discarded upstream. Model telemetry as a separate reliability pipeline with its own SLIs: ingestion success, end-to-end sample delay, dropped telemetry rate, storage query availability and alert-delivery age. Synthetic end-to-end probes should use safe test identities and measure actual completion, not only a 200 response from a static health endpoint.
Check your reasoning
- Differentiate missing telemetry from measured zero service errors.
- Ensure exporter failure cannot stall normal customer requests without an explicit contract.
- Size finite memory/disk buffers and describe drop, retry timeout and collector crash limits.
- Provide independent synthetic signals and protected fallback diagnostic evidence.
- Test disconnection and reconnection, data timestamps and visibility loss explicitly.
Common mistake: Persistent collector buffering guarantees every trace survives any duration of telemetry outage.
Read the answer explanation
Keep request instrumentation bounded, use independent probes and explicitly report export gaps — Collector queues and persistence are bounded. Customer traffic should not be allowed to fail silently due to a best-effort telemetry export path.
Apply it elsewhere
An agent platform's tracing backend fails while agents continue executing privileged tool calls. Distinguish best-effort debug traces from mandatory action audit records and define their delivery and failure policies.
Compare your approach
Separate service and telemetry failures, protect the request path from exporter backpressure, size bounded buffering, detect freshness gaps, preserve independent probes and fallback evidence, and verify with controlled failure testing.
One more constraint
If the error-rate graph contains no samples for ten minutes, does it prove that the application had zero errors?
Quick revision
A telemetry gap is unknown information, not zero errors. Avoid synchronous customer-request dependence on exporters. Monitor collectors, queue occupancy, drop counts and sample freshness independently. Use bounded retries and optional durable buffering, recognizing that these mechanisms can still lose data. Keep external synthetic probes and a limited break-glass evidence path outside the most likely shared failure domain. Rehearse the telemetry outage and ensure customer latency and alert semantics remain sane.
References
- Collector resiliency, queues, retry and persistent storage · OpenTelemetry
- Monitoring distributed systems · Google SRE
- Collector overview and pipelines · OpenTelemetry