A checkout platform handles 2,000 eligible requests per second and promises 99.95% good events over thirty rolling days. A new release produces 0.4% errors for 45 minutes. Calculate burn rate and propose page/ticket decisions under real request volume.
Reliability & Failure Recovery · Senior
Checkout is 99.9% reliable. Why did one bad hour consume so much budget?
The Dashboard Was Green. The System Was Not. · Part 4 of 6 · 5 min read
Read the worked explanation ↓Think first
A checkout platform handles 2,000 eligible requests per second and promises 99.95% good events over thirty rolling days. A new release produces 0.4% errors for 45 minutes. Calculate burn rate and propose page/ticket decisions under real request volume.
Take a few minutes to form an approach, then compare it with the worked explanation.
Check the exercise numbers
The allowed bad fraction is 0.05% = 0.0005, so 0.4% errors burn at 0.004 / 0.0005 = 8×. At a steady 2,000 requests/s for 45 minutes, there are 5.4 million requests and 21,600 bad events. If that rate represents the full thirty-day population, its budget is 2,592,000 bad events; this incident spends about 0.833% of it. With otherwise clean history, the example 14.4× one-hour page does not fire, nor does a six-hour 6× average after only 45 minutes. Decide explicitly whether this ongoing customer harm needs a separate faster symptom page, a differently chosen burn policy, or a ticket; test the actual rolling-window data rather than comparing an instantaneous 8× only to long-window thresholds.
Reveal the worked explanation
Interview question. A checkout API has a 99.9% availability SLO over a rolling thirty-day window. The on-call team gets either no alert for a serious short outage or constant alerts for tiny fluctuations. Explain error budgets and design multi-window burn-rate alerting that pages for real danger without paging for noise.
At a planning meeting, somebody hears "99.9%" and says that sounds nearly perfect. Then an incident takes ten minutes and customers cannot place orders. You tell them the monthly target is still mostly intact. Technically, maybe. Operationally, that ten-minute outage spent a meaningful part of the time budget, and an ongoing outage could spend the rest faster than anyone realizes.
Start with the SLI. For checkout, I might define an eligible request as a user-initiated attempt that reaches our edge, and a good event as one that produces the expected checkout result within a latency deadline. Valid card declines should not be failures of availability merely because they produce a business rejection. Internal errors, timeouts and broken sessions may be bad events. We should explicitly handle duplicate submissions, monitoring probes, and requests where the gateway never observed a client connection. A vague "HTTP 200 ratio" is not a complete SLI.
Suppose the target is 99.9% good events. The allowed bad-event fraction is 0.001, or 0.1%. Over thirty days, if request volume is roughly stable, this corresponds to 43.2 minutes of equivalent full outage. For a request-based SLO the actual budget is measured in eligible requests, not literal downtime minutes. The time equivalence is only a helpful approximation under steady load. This distinction matters when a payment incident happens during a huge seasonal sale.
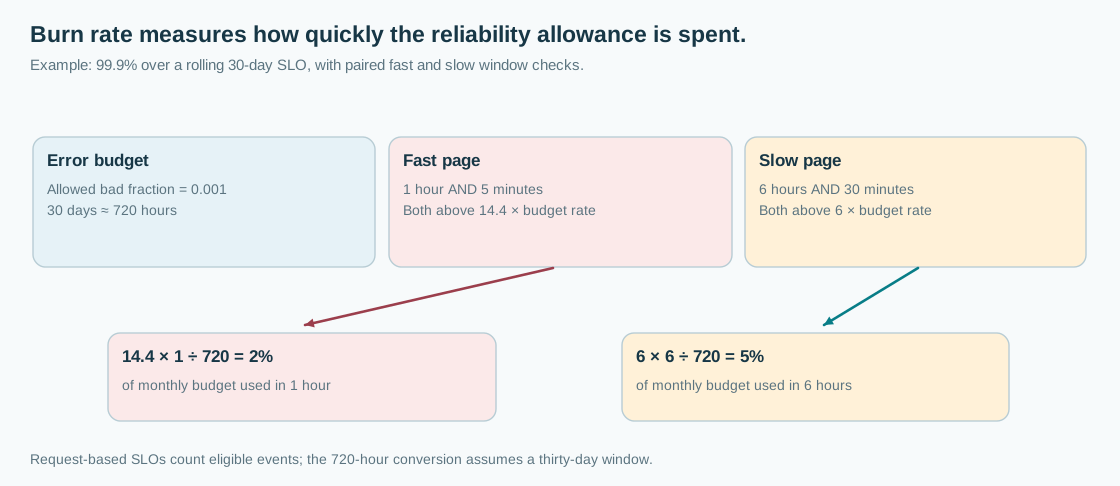
Now define burn rate. It is the observed bad-event fraction divided by the allowed fraction. If 1% of eligible checkout attempts are bad, a service with a 0.1% budget is burning at 0.01 / 0.001 = 10 times the sustainable rate. If all requests fail, the instantaneous burn is 1,000 times the target allowance. The SLO might still be technically passing over thirty days when the incident begins, yet waiting for it to fail before alerting would be reckless.
A naive five-minute error-rate alert sees every brief hiccup and pages on-call constantly. A naive thirty-day-window alert reacts so slowly that the budget can vanish before someone is notified. Google's SRE Workbook presents multi-window, multi-burn-rate alerting as one reasonable compromise. For a thirty-day 99.9% SLO, a fast page condition often combines a one-hour window with a five-minute confirmation window, both above 14.4x burn. A slower page uses six hours and thirty minutes above 6x. The short window helps the alert clear after an incident instead of remaining active only because old bad requests are still inside a longer window.
Where do 14.4 and 6 come from? At 14.4x for one hour, budget consumption is 14.4 × 1 / 720 = 0.02, or 2% of a thirty-day budget. At 6x for six hours, it is 6 × 6 / 720 = 0.05, or 5%. These are policy choices, not constants of nature. The combined long-and-short check asks whether the problem is material over the long window and still happening recently. Since an alert rule evaluates over rolling windows, real firing timing also depends on scrape intervals, traffic, and the for duration if configured.
Imagine ten minutes of 100% failure followed by complete recovery. In a simple stable-volume model, that would consume 10 / 43.2, about 23% of the month's equivalent time budget. The fast-window condition will likely detect the outage, but not instantly at the first bad request. The long-window average has to cross its threshold. We should test rule evaluation against synthetic incidents of different lengths and traffic levels rather than assume the chosen thresholds meet the team's desired detection latency.
What if a low-volume service has only three requests a minute? A handful of failed attempts can produce enormous ratios and noisy alerts. Use minimum sample-volume safeguards, longer windows or explicit critical-event signals suited to the product. Those mechanisms trade detection speed for statistical confidence. Do not silently hide a severe event just because aggregate traffic was small. Checkout payment capture failures may deserve a dedicated correctness alarm regardless of aggregate SLO burn.
I also distinguish page from ticket. Rapid consumption of the remaining budget justifies waking somebody who can mitigate customer harm. A slow leak may justify scheduled engineering work. An error budget is a tool for deciding how aggressively to release and operate a system, not a promise that being under target makes every incident unimportant. If budget consumption persists across a series of releases, the organization may slow risky deployments until corrective work restores room for change.
In an interview, the strong answer isn't a memorized PromQL snippet. It includes a defensible SLI, a numerator and denominator you can actually measure, a measured error budget, short and long alert windows, low-traffic concerns, and a rehearsal with recorded incidents. Otherwise the team has invented an attractive percentage, not an operational reliability program.
Go deeper
A typical fast-page condition tests bad_rate_1h > 14.4 * 0.001 and bad_rate_5m > 14.4 * 0.001. A slow-page condition tests bad_rate_6h > 6 * 0.001 and bad_rate_30m > 6 * 0.001. The two page conditions are ORed. These represent the SRE Workbook's example, not a mandatory configuration for every service. Counters must account for resets and dropped or unobserved requests, and histogram-based latency eligibility must be defined consistently. Revisit the thirty-day assumption if the business SLO has a calendar-month or weekly window instead.
Check your reasoning
- Define eligible user requests and good/bad outcomes without treating valid business rejection as failure.
- Calculate bad-event fraction, error budget and 30-day equivalent time caveat.
- Derive burn rate and 14.4x fast and 6x slow paired window logic.
- Separate page-worthy ongoing fast burn from lower-priority slow depletion.
- Handle low sample volume and rehearse alert timing on known incident patterns.
Common mistake: A 99.9% availability goal is permission to ignore any short outage while the thirty-day score is above target.
Read the answer explanation
Use a customer SLI and paired fast/slow burn-rate checks, then test alert sensitivity — Burn rate quantifies how quickly allowed bad events are being spent, so pages can fire before the entire thirty-day budget is exhausted.
Apply it elsewhere
A payroll job runs once a day. Explain why request-rate burn alerting may be inappropriate and design a deadline-based SLI and alerting policy instead.
Compare your approach
Specify event eligibility, separate failure from valid business rejection, compute bad-event fraction and burn rate, use meaningful paired windows, handle low traffic, and validate the alert policy against incident traces.
One more constraint
Is an SLO of 99.9% over thirty days literally a permission to be completely down for 43.2 minutes at any point in the month?
Quick revision
An SLO is a customer-facing target over a defined population and window. For 99.9%, the permitted bad-event fraction is 0.1%. Burn rate is the observed bad fraction divided by that allowance. Multi-window alerts combine a longer significance test with a shorter recency test. For a thirty-day SLO, 14.4x over one hour uses about 2% of budget and 6x over six hours uses about 5%. Choose notification severity, traffic safeguards, and test cases from actual service behavior.
References
- Alerting on SLOs and multi-window burn rates · Google SRE Workbook
- Implementing SLOs · Google SRE Workbook
- Recording rules and alerting · Prometheus