Orders are accepted in 150 ms, but 4% have confirmation times above 30 seconds. You can instrument only two more stages today. Where do you place measurements and what counterexample would invalidate your diagnosis?
Reliability & Failure Recovery · Staff
The order completed in 200 ms. Why did the customer wait 40 seconds?
The Dashboard Was Green. The System Was Not. · Part 1 of 6 · 5 min read
Read the worked explanation ↓Think first
Orders are accepted in 150 ms, but 4% have confirmation times above 30 seconds. You can instrument only two more stages today. Where do you place measurements and what counterexample would invalidate your diagnosis?
Take a few minutes to form an approach, then compare it with the worked explanation.
Reveal the worked explanation
Interview question. A checkout request calls fifteen services and publishes a message. The API returns in 200 milliseconds, but the customer sees an order confirmation forty seconds later. Show how you would determine where the time went, including the asynchronous part of the workflow.
Imagine calling the checkout API with a stopwatch. The server responds with 202 Accepted almost immediately. The order page keeps showing Processing, so the customer refreshes twice, then contacts support. Every synchronous HTTP span on the checkout trace looks fast. We can truthfully say the API is responsive, but we cannot truthfully say the order completed quickly. Those are different measurements.
The first decision is to define the end of the journey. For this product, suppose completion means the order becomes visible as confirmed in the customer's read model, not merely that a message was placed on a broker. I want timestamps for acceptance, durable publication, dequeue, start of processing, authoritative commit, read-model update, and visibility to the browser. Give every order a stable, privacy-safe correlation identifier. The order ID is for joining business facts, while a trace ID connects instrumented execution paths. We need both because neither answers every question.
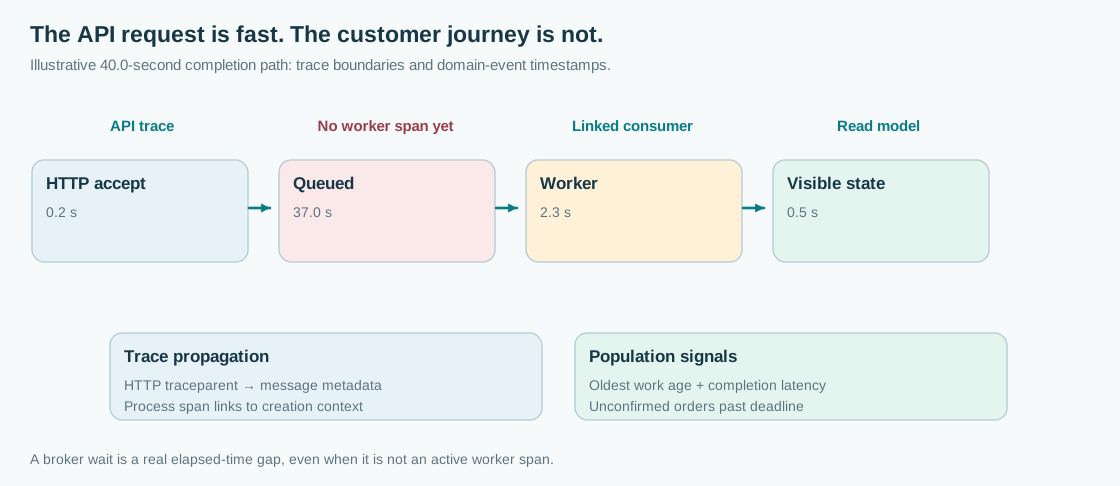
Now place a timeline beside the trace. In one hypothetical request, the API took 0.2 seconds, the message waited 37 seconds, the consumer did 2.3 seconds of work, and the confirmed state took 0.5 seconds to become visible. That totals forty seconds. The queue accounts for nearly all of the delay. Increasing API replicas or optimizing the checkout controller would have almost no effect. I would verify these numbers with metrics over many orders before deciding that the single example is representative.
The tricky part is the asynchronous boundary. Ordinary HTTP instrumentation propagates W3C traceparent headers, allowing a downstream server span to associate itself with its caller. A queue message needs creation context in its message metadata. Do not assume the broker automatically turns a publish span into a child of a later process span. OpenTelemetry's messaging conventions generally use span links for consumer processing, especially with batches, because one consumer operation may process records created by different traces. For a single message, some instrumentation permits using the creation context as parent. Either model can establish causality, but we must know which our instrumentation implements.
There is another nuance. Waiting in a broker for 37 seconds is not normally a 37-second CPU span inside the worker. The producer span ends after publication and the consumer's processing span begins after delivery. The blank space is evidence, not necessarily missing instrumentation. Record enqueue time and first-processing time, then calculate message age when processing begins. If consumer clocks may be skewed relative to producer clocks, the measured cross-host interval includes that uncertainty. Within-process elapsed time should use a monotonic clock where available. We can corroborate the queue wait with broker timestamps and age-of-oldest-work metrics.
I would inspect the order's state transitions next. Was the message published only after the database transaction committed? Was a consumer paused during a deployment? Did one partition accumulate backlog while the overall queue depth stayed flat? Is a worker blocked on a payment provider, or are there fifteen services but only two actually on this request's critical path? A trace waterfall is useful only if we distinguish sequential dependencies from branches that execute concurrently. Adding every span duration together can double-count parallel work.
For the browser-to-customer segment, I would inspect whether the UI is polling, waiting for server-sent events, or using a cached endpoint. If the database committed at second 3 and the page noticed it at second 40, the broker might be innocent. We need an end-to-end confirmation latency histogram starting at accepted user action and ending at observed customer state, with meaningful labels such as product flow and region. Keep customer IDs out of metric labels. Use the trace or a controlled lookup for individual orders.
When asking this in an interview, I am interested in whether you can avoid the tempting but wrong fix. If a dashboard says 'checkout p99 180 ms', ask exactly which boundary the histogram measures. Does it stop at an HTTP acknowledgment? If so, the customer can wait all afternoon without changing that metric. A second SLI should measure completion time and a third should count accepted orders that never reach a terminal state within a deadline. Separate successful completion, expected rejection, and unknown outcomes rather than recording everything as an HTTP success.
At Staff level, I would also challenge telemetry survivability. If we only retain 1% of traces, this customer's execution may not exist. Business lifecycle events, aggregate latency distributions and broker gauges must remain useful without a sampled trace. If the trace context is lost at a queue hop, correlate by order ID in carefully access-controlled logs while fixing propagation. Never solve correlation by putting card numbers, addresses or unbounded user identifiers into trace attributes.
The finished diagnosis should sound like this: "The user-facing confirmation took forty seconds. In the illustrated order, 37 of the 40 seconds—92.5%—elapsed in the queue before worker processing began. If population measurements confirm the same concentration in one partition after a consumer deployment, that is the next mitigation target. The API response metric never included that wait. We'll restore consumption capacity now, then correct the partitioning and measure confirmation latency as a first-class customer signal." That answer is more valuable than a screenshot of a very impressive trace viewer.
Go deeper
In OpenTelemetry's messaging semantic conventions, producer-to-consumer correlation depends on propagated message creation context. A consumer process span commonly links to that context. This choice avoids claiming one parent for a batch containing independently created messages. The exact instrumentation and convention stability vary across SDKs and brokers, so inspect emitted spans instead of assuming a topology. For cross-host durations, instrument clock synchronization and record timestamp provenance. For a message redelivered three times, distinguish original creation age from time since the latest delivery attempt and avoid counting all three attempts as three unique customer orders.
Check your reasoning
- Define completion as a customer-observed terminal state rather than API acceptance.
- Trace or correlate enqueue, first-processing, commit and read visibility with source timestamps.
- Propagate message creation context through the broker and use span links appropriately for batches.
- Reconcile queue age and other population signals with sampled execution examples.
- Name the dominant critical-path stage, reject naive sums of parallel spans and propose a targeted mitigation.
Common mistake: All HTTP spans total 200 ms, so confirmation latency cannot be forty seconds.
Read the answer explanation
Measure message enqueue-to-first-processing wait and confirmation state against a user-facing SLI — The async gap is real elapsed time but often lacks an active worker span. Completion must be measured across the queue and derived-view boundary.
Apply it elsewhere
A video upload API returns in 100 ms while transcoding completes twenty minutes later. Define an accurate user-facing completion SLI and trace-correlation path through the media queue.
Compare your approach
Define a customer endpoint, propagate message creation context, measure enqueue-to-start gaps, avoid summing parallel spans, distinguish samples from population metrics, and mitigate the actual bottleneck.
One more constraint
Can you add together all the spans in a parallel trace to calculate end-to-end latency?
Quick revision
A fast HTTP response may only mean acceptance. Define the real completion event, follow the business ID through all asynchronous states, and record queue age separately from consumer execution. Propagate trace context in message metadata, using links for batch consumers when appropriate. Inspect critical-path time rather than summing parallel spans. Use completion latency and stuck-order counts as population signals, traces as diagnostic examples, and privacy-safe logs for correlation when tracing is incomplete.
References
- Messaging span semantics and span links · OpenTelemetry
- Context propagation and W3C traceparent · OpenTelemetry
- Trace Context specification · W3C