A 10% canary has worse p99 than stable, but it serves only enterprise users. Describe a fair experiment and how you would sample traces without turning on full tracing for the entire fleet.
Reliability & Failure Recovery · Staff
p99 doubled after deployment. Why do the sampled traces look fine?
The Dashboard Was Green. The System Was Not. · Part 2 of 6 · 5 min read
Read the worked explanation ↓Think first
A 10% canary has worse p99 than stable, but it serves only enterprise users. Describe a fair experiment and how you would sample traces without turning on full tracing for the entire fleet.
Take a few minutes to form an approach, then compare it with the worked explanation.
Reveal the worked explanation
Interview question. Ten minutes after a release, checkout p99 moves from 250 to 500 milliseconds. The error rate and fleet CPU barely move. You open the trace backend, and almost every trace looks ordinary. Walk through the investigation and explain what sampling changes about your conclusions.
Averages are sometimes comforting in precisely the wrong way. The dashboard says overall requests are slightly faster after the rollout. Meanwhile a minority of customers are waiting twice as long at the tail. Before blaming the last deploy, I want to know that we're looking at equivalent populations. New and old versions might be serving different regions, endpoints, customer tiers or request sizes. A fleet-level p99 mixes all those distributions and gives us a signal, not a causal explanation.
Start by writing down the claim: "For successfully completed checkout requests in region west, the new version has worse tail latency at comparable load." Then compare version-specific histograms using the same latency definition, time window, and traffic filters. I would inspect rates and error classifications too, because a release that fails slow requests quickly can improve apparent successful-request latency while making the user experience worse. Do we measure end-to-end server time, an upstream reverse proxy's time, or browser-observed time? A single graph title doesn't settle that.
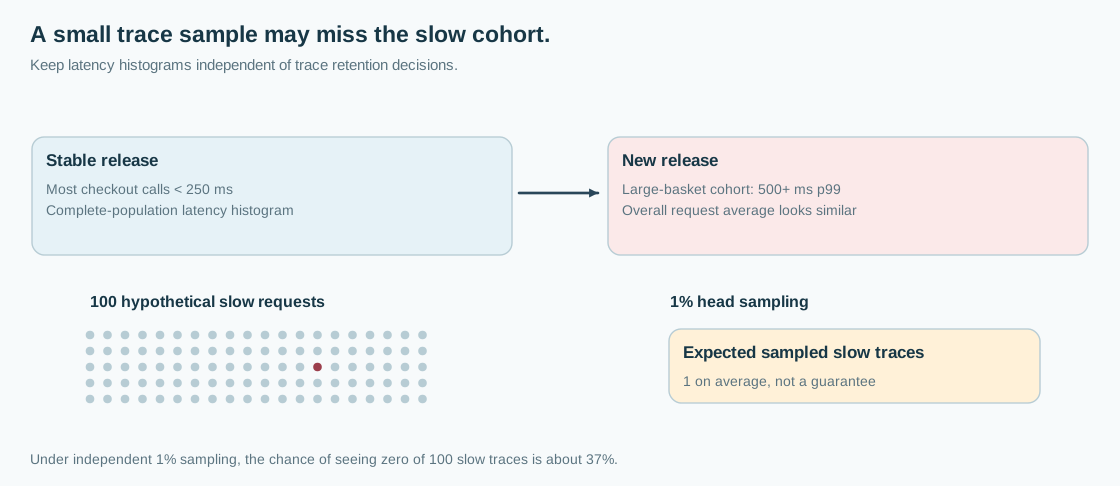
Suppose old-version p99 is 250 ms and new-version p99 is 500 ms, but only 5% of traffic reaches the new version. That group may be a deliberate canary. Breaking data down by deployment version is essential. Then slice by route, region, instance type, dependency outcome and payload category. Use bounded dimensions such as a request-size bucket, not raw customer IDs. If the regression appears only in large checkout baskets on the new version, we have a more testable hypothesis than "the network got slow."
So why are the traces unhelpful? The service uses 1% head sampling, decided at request start. Head sampling can choose a trace based on its trace ID or initial attributes, but it cannot know that a downstream call will later take 900 ms. If there are 100 slow requests in a short window, a simple independent 1% sample has an expected count of one slow trace, and the probability of catching none is about 0.99^100, roughly 37%. That model assumes independent sampling decisions and an unbiased eligible population. Real deployments may have correlated traffic, parent-based decisions, dropped exports and incomplete instrumentation, so one good-looking sample is weaker evidence still.
An exemplar can help bridge an aggregate histogram observation to a representative trace ID, when the metrics pipeline records one and the trace remains retained. It is not proof that the exemplar explains the entire tail. I'd first ask whether the aggregate latency histogram is computed from all eligible requests or reconstructed from sampled traces. The latter requires explicit sampling-aware statistical handling and may bias estimates if slow traces were preferentially retained. Keep primary SLIs generated from unsampled measurements wherever practical.
A targeted capture is often faster than changing the fleet's sampling rate blindly. Turn up collection for the affected route and release cohort with a bounded time limit and data budget. Alternatively, use collector-based tail sampling to keep traces after seeing errors or high latency. Tail sampling requires retaining candidate span data until a decision, routing all spans for a trace consistently to the decision maker, and having enough capacity for busy periods. A 30-second decision wait does not mean every slow trace finishes before then. Late spans, dropped collector queues and traces already excluded by upstream head sampling still limit what the collector can reconstruct.
Next compare one fast trace and one slow trace of the same type of request. Find the first point where their critical paths diverge. Perhaps a new SQL plan on large carts goes from 20 to 300 ms, or a third-party request starts retrying behind a semaphore. Attribute server queue time separately from execution. The trace should give us a hypothesis that agrees with population telemetry, not a dramatic waterfall used as a substitute for it.
I would also inspect the rollout timeline. Did p99 change at the version transition or earlier with a deployment-independent load increase? Can we find old and new pods serving the same client path at the same time? A gradual canary offers something close to a natural comparison, but only if traffic assignment is not biased. Sticky sessions, version-gated features and user cohort selection can invalidate a naive comparison. If uncertain, adjust the rollout to obtain a fairer sample or run a controlled experiment.
If the release is still rolling out and customers are being harmed, containment comes before perfect certainty. Pause promotion. If the new version's error-budget consumption is serious and a safe rollback exists, roll back while preserving evidence and watching whether p99 recovers. Avoid simultaneous changes to the deployment, database and network because you'll lose the ability to attribute the improvement. The experiment itself should have a predicted outcome and an explicit stop condition.
A convincing interview answer ends with two statements: "We know the tail regression affects large baskets on release 42, not every checkout," and "We have enough unbiased aggregate measurements to justify action despite sparse traces." Sampling determines which individual executions we can inspect. It should not decide whether the underlying customer experience exists.
Go deeper
OpenTelemetry describes head sampling as early trace selection and tail sampling as selection after examining all or most of a trace. The collector's tail-sampling processor has finite trace buffers and policy decision delays. Parent-based head decisions upstream can prevent downstream collectors from ever receiving needed spans. If different sample probabilities are mixed, raw sampled-trace counts do not estimate true request counts without carefully known inclusion probabilities. Histograms from all actual requests should remain the authoritative latency SLI. Targeted or tail-sampled traces explain representative mechanisms.
Check your reasoning
- Establish comparable release cohorts, routes, regions and eligible request populations.
- Use unsampled population histograms for p99 and errors, not a small collection of traces.
- Explain the limits of head sampling and approximate chance of missing rare slow requests.
- Describe targeted or tail sampling with collector state, routing and retention constraints.
- Confirm a suspected change with evidence and choose a safe rollout pause or rollback.
Common mistake: Every trace we kept is fast, so the histogram p99 regression must be wrong.
Read the answer explanation
Compare matched cohorts, inspect sampling configuration and capture slow traces deliberately — Head sampling cannot select events based on latency it has not seen. Population signals and samples answer different questions.
Apply it elsewhere
After a compiler update, one workload class experiences longer JVM pauses while average latency improves. Design cohort comparisons and trace capture without confusing the selection of traces with the true population.
Compare your approach
Use comparable cohorts, unbiased aggregate latency distributions, probability-aware sampling reasoning, trace exemplars, targeted capture, and rollback or experiment criteria.
One more constraint
If one percent of requests are head-sampled, can you assume exactly one out of every hundred *slow* requests appears in the trace backend?
Quick revision
A p99 regression is a population claim, not something a handful of traces can confirm or refute. Compare equivalent versions and workloads, isolate the affected slice, and use full-population histogram data for SLIs. Head sampling may miss rare slow requests because it cannot see future latency. Targeted or tail sampling improves diagnosis but introduces buffers, routing constraints and selection bias. Use representative traces to locate a cause, then confirm that cause against aggregate telemetry and controlled rollback evidence.
References
- Head sampling versus tail sampling · OpenTelemetry
- Tail-sampling processor and capacity behavior · OpenTelemetry Collector
- Histograms, buckets and quantitative interpretation · Prometheus