Why reclaim can be worse than an immediate failure
Linux distinguishes several broad classes of resident pages. Clean file-cache pages can often be reclaimed and read again from the backing file later. Dirty file pages may need writeback first. Anonymous memory, such as portions of heaps and in-memory hash tables, may be swapped if swap is configured and policy permits it. Some pages are unevictable or require special handling.
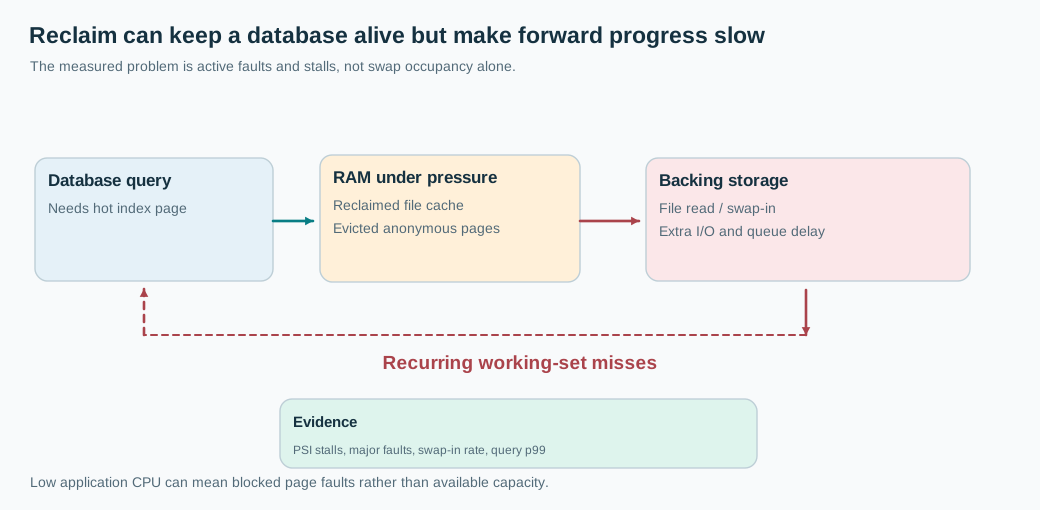
The kernel may scan memory to find reclaimable pages, evict cache and write some pages out. If the database touches an evicted file page, it must read it again. If a thread touches an anonymous page that was swapped out, it incurs a swap-in fault. Either can add I/O to a request that previously completed entirely from memory.
A database that repeatedly scans a working set larger than the available RAM can churn: it loads pages just evicted to make room for other pages it will soon need. That is different from healthy file-cache recycling. Reclaim activity can consume CPU and saturate storage, while application CPU looks unexpectedly low because its threads wait on page faults or I/O.
No single metric proves this. A large value for SwapUsed can represent pages swapped out long ago and never touched again. What matters for the incident is active swap-in and swap-out traffic, major page faults, reclaim stalls, and the overlap with query latency. Occupied swap can coexist with good performance if no hot pages are faulted back in.
An incident timeline I would reconstruct
Start with when latency changed. Compare available memory, resident and virtual size, page cache, swap I/O rate, major faults, reclaim scans, pgscan and pgsteal where available, and storage latency. On modern Linux, pressure stall information from /proc/pressure/memory helps quantify how much time tasks lose waiting on memory. Under cgroup v2, memory.pressure, memory.events, memory.current and memory.swap.current can localize problems to containers.
I would use vmstat carefully: sustained si and so activity is more meaningful than a single swap-used number. Check disk read and write rates together with queue latency. If storage is saturated by an unrelated backup, high fault latency may be a symptom of I/O competition rather than memory alone. Compare actual working-set growth to the start time of the analytics job.
Inspect the database's own memory controls. A configured 60 GB buffer pool does not mean the process consumes exactly 60 GB. Sort and hash workspaces, query parallelism, connections, allocators and mapping overhead add pressure. For a memory-mapped engine, file cache and process RSS need careful interpretation because metrics can overlap. Avoid adding free fields together as if they were independent allocations.
The first production decision
During an active incident, I would stop or rate-limit the colocated analytics workload if its resource contract allows it. That might free memory and I/O capacity faster and more safely than restarting the database. A restart can temporarily free allocations but also destroys warmed caches and may produce a new thundering herd when traffic reconnects. If a database process has genuinely leaked memory, a controlled restart may still be required, but use evidence rather than habit.
Do not set swap to zero universally as the first step. Disabling swap can prevent some latency failure modes but may turn a survivable pressure condition into an OOM kill, depending on kernel and cgroup configuration. The right policy depends on how the service handles memory exhaustion, whether it can shed load, and how costly an abrupt termination is. Latency-sensitive databases often reserve headroom and strongly control memory overcommit, but the safety tradeoff must be explicit.
Design the budget, not just the limit
I would reserve capacity for the database's working set, variable query memory, the operating system, page-cache needs, networking, and recovery tasks. Put analytics in a separate resource domain or place enforceable memory and I/O limits around it. For cgroups, memory.high can apply reclaim pressure before hitting a hard memory.max, while memory.max limits usage and may lead to cgroup OOM if reclaim cannot make sufficient room. Their behavior must be tested against the database's fault model.
Add overload protection before memory is exhausted. Limit concurrent memory-heavy queries, bound per-query workspace allocation, and admit fewer background scans when memory pressure rises. Keep dashboards for memory PSI, major faults, swap I/O and p99 query classes, not only percent-used RAM.
The deeper interview point is that a process can keep running while the machine loses forward progress. Availability that reports only process liveness misses that distinction. Your capacity design should protect the resident working set needed for the latency promise, not just prevent the operating system from killing a PID.