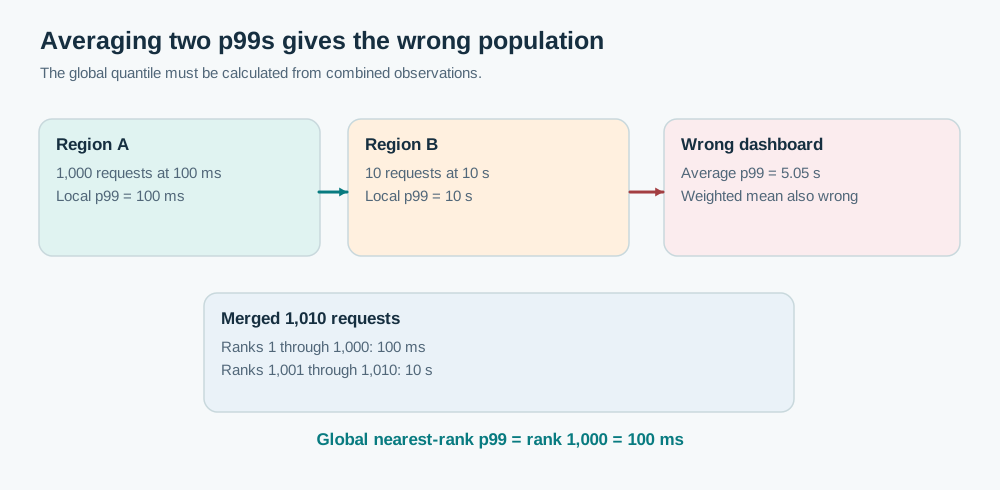
The weighted average is also wrong
A reasonable interviewer follow-up is “What if we weight each regional p99 by request count?” In this example, that produces approximately 198 milliseconds, which is still not the global p99. Weighting fixes one obvious imbalance but not the fundamental information loss. Knowing one percentile from each region doesn't tell us how many observations sit in every range of latency.
For a more general illustration, two regions can report the same p99 while having quite different shapes immediately below that threshold. Their combined p99 can therefore change when the traffic weights change, even when neither regional p99 moves. This is why I wouldn't build a global latency SLA out of an average of locally calculated quantiles.
The correct design starts with a mergeable representation of the observations, not the final regional answer.
Merge populations first, calculate the quantile second
A classic histogram records cumulative observations under configured latency boundaries. Suppose buckets end at 100 ms, 300 ms, 1 s, and +Inf. Each region reports a cumulative count for each boundary. To combine regions, sum matching buckets, then estimate the quantile from the combined distribution.
For Prometheus-style classic histograms, the shape is conceptually:
histogram_quantile(
  0.99,
  sum by (le) (rate(http_request_duration_seconds_bucket[5m]))
)
The bucket counts are counters, so the query derives rates over a consistent time window and sums by the le boundary. If we need a global result across all regions, we intentionally remove the region dimension during the aggregation. If we want p99 per API route, retain the route label along with le.
Prometheus also supports native histograms, where a histogram observation is stored as a structured sample rather than a separate time series for each classic bucket. The global form uses compatible native histogram streams summed before the quantile calculation. Instrumentation support, bucket resolution and compatibility still need verification. Prometheus histograms guidance.
Be precise about what a histogram proves
A histogram usually does not store every exact latency. A quantile interpolated from buckets is an estimate whose accuracy depends on the bucket boundaries or schema resolution. If the business cares whether 99% of requests complete within 300 milliseconds, there is an even more direct calculation: count observations at or under the SLO threshold, divided by all observations over the same interval. That threshold fraction avoids pretending we know an exact p99 when a histogram's resolution is coarse.
Buckets must agree across the populations we merge. If one region uses 100, 300 and 1,000 ms boundaries while another uses 125, 500 and 2,000 ms, blindly adding the same named bucket labels can be incorrect. A native histogram implementation may be able to reconcile compatible schemas, but the details are product-specific. Define an instrumentation contract rather than letting every service improvise latency buckets.
Time alignment matters as much as bucket alignment. A five-minute window in one region and a ten-minute window in another do not describe the same population. Exported summaries computed over application-local sliding windows may also use different decay semantics. A global panel should describe the exact interval and which request classes are included.
Cost and cardinality have not disappeared
Classic histograms multiply the number of time series by their bucket count, plus the count and sum series. If every histogram is labelled with raw user IDs, no quantile function will rescue the cardinality explosion. Use bounded dimensions and select bucket layouts around meaningful thresholds. Native histograms can reduce some series-count overhead, but their samples have their own size and processing costs.
I would also ask how partial failure should display. If the APAC metrics collector is down, a dashboard computed over just the remaining regions should not be labelled “global” without a coverage warning. A low global p99 because the slowest region stopped reporting is a measurement failure, not a performance improvement.
In a Staff interview, this is an opportunity to distinguish the mathematics from the monitoring tool. Averaging percentiles is invalid regardless of whether the dashboard is Prometheus, Datadog or an in-house engine. The design should preserve mergeable counts or distributions, combine matching populations, compute the quantile afterward, and communicate estimation error and missing coverage.