Skip to content

One dashboard opened a 30-day graph. Why did every metrics query slow down?

The Numbers Were There. The Answers Weren't. · Part 6 of 6 · 6 min read

Read the worked explanation ↓

Interview question. A company monitors 150,000 hosts at 15-second resolution. An engineer opens a dashboard over 30 days with a broad host selector and a few nested range functions. Moments later, query latency spikes across the metrics cluster. The engineer argues the panel is only 1,200 pixels wide and sends back fewer than 2,000 plotted points. Explain the load and design protection without making historical analysis useless.

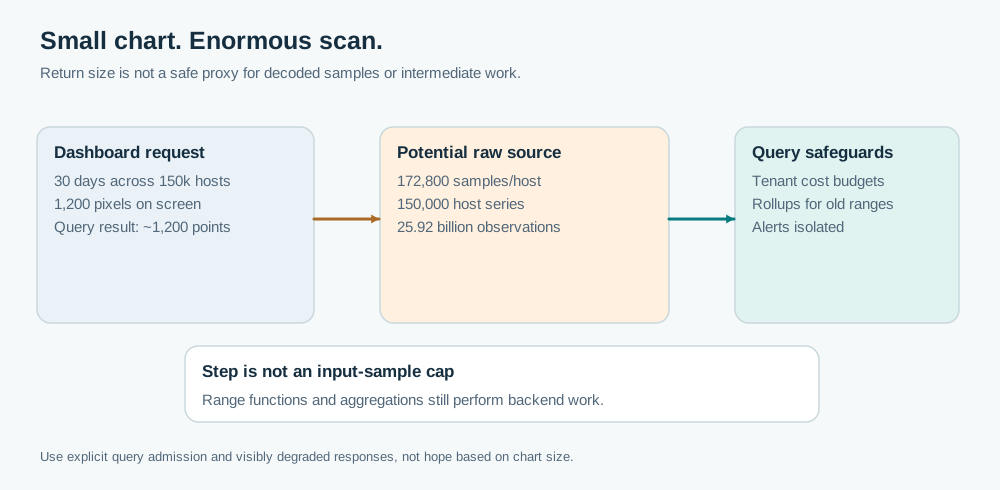
A chart's pixel count tells you remarkably little about the work required to produce it. The backend may need to fetch, decode and aggregate millions or billions of underlying observations to draw one line.

Start with a crude upper-bound calculation. One host contributes 30 × 24 × 3600 / 15 = 172,800 regularly sampled points over 30 days. Multiply by 150,000 hosts and you get 25.92 billion sample observations across that range, before missing data, changes in labels, rollups or additional series per host. This is an upper bound, not evidence that every point was read.

A narrow chart result can require enormous intermediate scans, while admission limits and rollups protect shared query capacity.
Think first

Build a metrics query frontend for 200 engineering teams. A tenant submits a 90-day regex query during an incident, while SLO alerts must evaluate every 30 seconds. Propose request admission, quota accounting, caching, rollups, cancellation and service-level isolation. Define what happens to over-budget queries.

Take a few minutes to form an approach, then compare it with the worked explanation.

Reveal the worked explanation

The expensive part is often hidden behind an innocent expression

Suppose the panel asks for the rate of a counter at many evaluation timestamps. A Prometheus range query has a start, end, and step. The step controls how frequently the expression is evaluated. It does not automatically mean the engine reads just one raw sample per rendered point.

A range function such as rate(x[5m]) needs samples in its lookback window. Nested subqueries, large label matches, joins and wide aggregations can force substantial intermediate work. Implementations can optimize repeated reads, but a high-level API result size does not bound internal IO, decoding, memory or CPU. Returning only 1,200 points is not an admission policy.

The query might also match more series than the user expects. An expression grouped by service can begin by reading every pod's series, only collapsing identities afterward. If the input labels have high cardinality, the store must search and process that population before the result becomes one service line.

This connects to labels and compression. A compressed time-series block saves disk and read bandwidth, but the query still needs to identify matching series and decode the relevant data. Neither efficient chunks nor small HTTP responses make broad queries free.

Protect the service before optimizing the chart

I would put explicit limits at the read interface: maximum execution time, maximum samples a query may load, concurrency limits, and separate budgets for interactive users versus background jobs. Prometheus exposes settings such as --query.timeout, --query.max-concurrency, and --query.max-samples. Check version-specific behavior. Prometheus command-line options.

A query that exceeds its budget should fail clearly or require an asynchronous job. It should not be allowed to consume the resources needed by incident dashboards and alert evaluation. Ideally, alerting and critical operational reads have reserved or separate compute capacity so that one exploratory dashboard cannot starve emergency detection.

For a multi-tenant cluster, fairness needs more than a global concurrency limit. A large tenant can occupy every available query slot with expensive requests. Allocate read capacity per tenant or workload class and bound queue lengths. Limit actual cost, not just request count. One request can cost thousands of times more than another.

Admission also needs to consider cancellation. Abandoned scans should stop rather than compete with active queries.

Make the cheap query answer the user's actual question

Ask what the engineer was trying to learn. A 30-day CPU capacity trend across all hosts probably does not require 15-second data for every host. A pre-aggregated hourly fleet summary might answer it quickly with a small number of series. A single-host incident at 13:42 yesterday needs a different query plan and finer source resolution.

I would maintain recording rules or a rollup pipeline for common service-level aggregates, with clear labels and retention. The dashboard defaults to summarized data over long ranges. It offers drill-down to finer data over bounded windows, and it warns when requested resolution is unavailable. Do not let the system silently substitute a lossy rollup for an audit query that requires exact points.

For example, 30 days contain 720 hourly buckets, compared with 172,800 raw 15-second samples per host. The numerical reduction is useful only if the hourly aggregate preserves what the panel needs. A monthly p99 cannot be manufactured from averaged hourly p99s, as the previous episode established.

A query cache reduces repeated work, not new broad scans, and needs a freshness policy. Query splitting across time and stores can improve parallelism, yet can also overwhelm downstream workers if concurrency is uncontrolled. Faster execution of one user's query is not success if everyone else's queries become unreliable.

Build an operational budget the team can reason about

Before execution, estimate the number of selected series, time span, step, expression shape, and expected sample volume. The estimate will be imperfect, especially for nested functions. Use it to reject clearly dangerous queries or redirect them to an offline workflow. During execution, measure actual decoded samples, memory, durations, cache hit rates, cancellations and queue wait time.

I would test a worst-case dashboard during a simulated incident while alert queries are running. Acceptance means the exploratory request either completes inside its budget or fails predictably, and critical alerts continue operating. A system that answers everything eventually but blocks incident monitoring is not operationally correct.

The interview takeaway is practical: result cardinality is not query cost. Limit and isolate work, preserve query fairness, use appropriate resolution, and expose why a request was refused. Those controls make historical exploration possible without giving any one browser tab the ability to take down telemetry during the very outage it needs to explain.
Go deeper

PromQL range evaluation uses repeated expression evaluations over a selected period. The evaluation step is not a hard cap on input sample reads. Limits such as max_samples, timeout and concurrency are separate controls, and the exact resource semantics vary by implementation and release. Historical TSDB gateways may also fetch compressed blocks over object storage, adding network and cache pressure.

For multi-tenant operations, meter samples touched or other real work as well as query count. Separate critical alert workloads from interactive exploration, bound parallel fan-out, propagate cancellation and avoid unbounded queues. Precomputed recording rules improve common queries but require freshness semantics, retention and a correct aggregation function.

Check your reasoning

  • Verify 172,800 samples per 30 days/host and 25.92 billion across 150,000 hosts.
  • Explain evaluation step versus backend samples touched by range functions and aggregations.
  • Enforce sample/time/concurrency limits, query cost estimates and per-tenant fairness.
  • Protect alerting capacity from exploration and handle cancellation and budgets.
  • Use appropriate rollups or offline execution with clear precision and coverage semantics.

Common mistake: Returning 1,200 graph points guarantees the backend processes at most 1,200 input samples.

A small 30-day chart triggers enormous intermediate TSDB work. Which protection preserves shared monitoring availability?

Read the answer explanation

Budget actual query work, isolate critical alerts, and use validated coarse historical aggregates — Backend scan, decoding and intermediate aggregation work can be enormous even when the final chart has few points.

Apply it elsewhere

An AI inference platform stores per-model token-usage metrics and trace-derived events. One customer asks for a year of p99 token latency broken down by user ID. Design a safe interactive query and an offline path while preserving tenant isolation and explaining the accuracy limits of old data.

Compare your approach

Verify the 25.92-billion-observation upper bound, distinguish returned points from processed samples, explain series selection and range-function work, prioritize alert workloads, account for per-tenant query cost, and choose valid rollups without pretending coarse data retains raw precision.

One more constraint

Does a `query_range` step of one hour guarantee the TSDB reads only 720 raw samples for a 30-day chart?

Quick revision

A 1,200-pixel graph may need billions of raw samples before aggregation. With 150,000 hosts sampled every 15 seconds, a 30-day range contains up to about 25.92 billion observations for one series per host. The query step limits evaluation timestamps, not necessarily input samples read by range functions. Enforce timeout, sample and concurrency budgets, per-tenant fairness, cancellation and protection for alerts. Use recording rules or historical rollups for appropriate queries while exposing resolution and coverage. The follow-up is how to support a rare, genuinely expensive investigation without destabilizing everyone else's dashboards.

References