On Monday, the product API served 50,000 reads per second with a 95% cache hit rate. On Tuesday, request volume remained almost identical, but the hit rate dropped to 80%. Database CPU rose, query queues formed, and the API began missing its latency objective.
The team says the cache is “still working for most requests.” That is true and not particularly reassuring.
Interview question. Estimate the change in database traffic, identify at least four different reasons the hit rate might have fallen, and explain how you would distinguish them before modifying TTLs or buying more cache capacity. Assume each miss leads to one database query for the first calculation, then challenge that assumption.
Think first
At 50,000 cache lookups/sec, hit rate drops from 95% to 80% during a release. Estimate origin request rates under a one-miss-one-read assumption. List competing causes and the measurements that distinguish them.
Take a few minutes to form an approach, then compare it with the worked explanation.
Reveal the worked explanation
Work out the miss rate, not just the hit rate
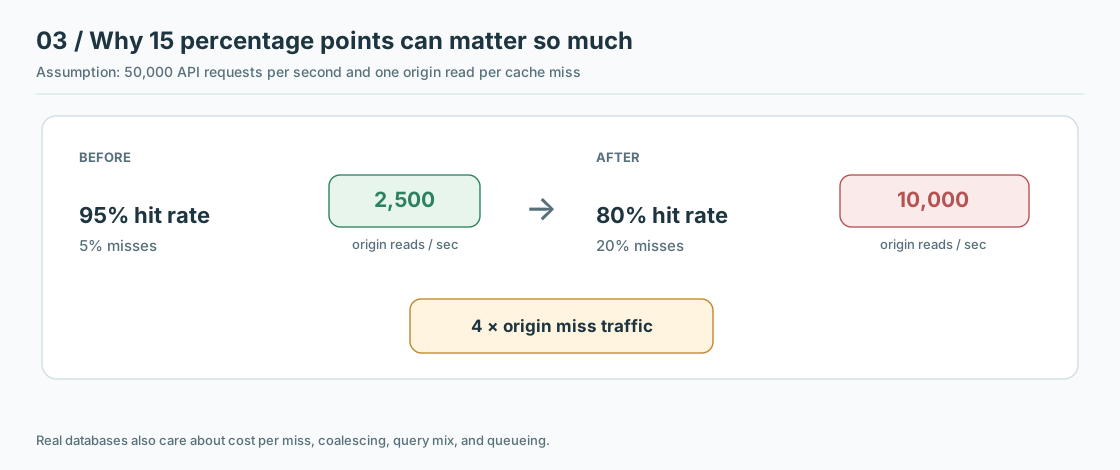
At 95% hits, five percent of 50,000 requests miss. That is 2,500 misses per second. At 80% hits, twenty percent miss. That is 10,000 misses per second.
A fall from 95 percent to 80 percent hit rate multiplies assumed origin requests by four
The hit rate fell by 15 percentage points. The implied database read rate rose fourfold. This is a ratio of misses, not a claim that database CPU automatically rises fourfold. Some misses may be coalesced, involve multiple queries, or hit a different downstream cache. Some cached operations may have far more expensive origin work than others.
The first question I ask is therefore not whether 80% is a good number. It is whether 10,000 origin reads per second is inside the database's stable capacity at the observed query mix.
If the database sustainably handles 6,000 such reads per second, the excess demand must queue, be rejected, or time out. Raising an application timeout can increase the amount of waiting work without raising capacity. This is an overload problem triggered by a workload change that looks small on a dashboard.
Look at the keys before changing the cache size
Several explanations can produce the same average metric.
A new release might accidentally add a random request ID to the cache key. Every request creates a new entry and reuse disappears. Increasing memory would not solve a key that is never requested twice.
A marketing campaign might bring in millions of one-time visitors. The working set grows. A cache that comfortably held last week's hot products now evicts them to make room. In that case memory pressure, evictions, and key popularity are relevant.
A deployment might shorten TTLs, causing entries to expire more often. Or a fleet-wide restart might temporarily replace warm instances with empty local caches. Those cases suggest expiration and rollout timing, not necessarily a bigger permanent working set.
A routing change might direct each customer to a different region whose cache has never seen them. One region could be healthy while another suffers misses. A global hit rate averaged across them hides the difference.
Finally, the cache can be reporting ordinary GET misses while the database pain comes from an entirely different path, such as a new synchronous write or a slow query plan. Correlation between a falling hit rate and rising CPU is a hypothesis, not proof of causation.
What I would measure in the first ten minutes
Plot application requests, cache hits and misses, origin read attempts, origin success, and latency on the same timeline, broken down by cache cluster, endpoint, tenant tier, and deployment version. Redis exposes keyspace hit and miss counters through INFO, but raw counts require rates and context. Redis also exposes eviction and memory information useful for narrowing the hypothesis.
I would sample key cardinality and normalized key patterns rather than log every raw key. A sudden explosion in distinct keys is a strong clue that key composition changed. Privacy matters too, since raw keys can include customer identifiers or secrets.
Then investigate bytes and cost, not just requests. A 90% hit rate for tiny product metadata can coexist with a low hit rate for expensive recommendation queries. Conversely, a cache with 99% hits can be a serious problem if the remaining one percent consists of very expensive misses. One blended success rate cannot express the consequence of a miss.
The fastest mitigation depends on what the evidence shows. Revert a broken key namespace, restore previous TTL settings, isolate a newly expensive query, increase cache capacity for a genuinely larger working set, or apply admission control while warming. Changing every TTL to an hour could hide the symptom while making price and policy data unacceptably stale.
Turn the number into a useful design contract
I would define the maximum affordable origin miss rate for each important operation. The cache hit rate then becomes a capacity assumption we monitor. If the database can handle 5,000 product reads per second and the API receives 50,000, the required effective hit rate is at least 90% under the simplifying one-miss-one-read model, with additional safety headroom for failures.
The contract should identify what happens below that threshold. Should lower-priority reads be throttled? Can certain content use bounded stale data? Can requests be coalesced? Which reads must bypass cache because correctness is more important? We do not need the same answer for every endpoint.
Interview takeaway: A cache hit ratio is a workload transformation. Convert percentages into origin traffic, verify that the traffic actually reaches the origin, and diagnose why the distribution changed before tuning eviction or buying hardware.
There is another way to produce enormous miss traffic even with plenty of memory. Clients can ask for keys that never existed in the first place.
Go deeper
An aggregate hit rate should be weighted by requests, but a capacity review may need to weight by origin cost or latency as well. Estimate a miss cost profile for each endpoint, such as CPU milliseconds, database pages read, bytes transferred, and downstream calls.
Admission policy matters separately from eviction policy. A one-time scan through millions of objects should not necessarily displace the frequently reused hot set. LFU variants, sampling, and TinyLFU-style admission strategies address aspects of this problem, but their effectiveness depends on the observed key distribution.
Be careful about cumulative metrics across cache node restarts. Convert counters to rates and handle resets explicitly or the graph itself can become misleading.
Check your reasoning
Calculate 2,500 versus 10,000 miss requests/sec and the fourfold increase.
Challenge the assumption that every miss costs one identical origin read.
Check key-cardinality changes, evictions, TTL distribution, routing and cold instances.
Segment hit/miss metrics by endpoint, tenant, region and release.
Select mitigation from evidence instead of reflexively increasing TTL for every key.
Common mistake: Describing a 15-point fall as merely 15% extra database load or assuming CPU rises exactly fourfold.
Read the answer explanation
From 2,500 to 10,000 per second. — Miss rate changes from 5% to 20%, so origin misses quadruple under the simplified assumption.
Apply it elsewhere
An AI prompt cache drops from 90% to 75% hits. What extra metric matters before calculating GPU spend?
Compare your approach
A miss has variable token cost and processing time. Weight misses by the actual prefill compute and request distribution.
One more constraint
What is the minimum hit rate when the origin budget is 4,000 reads/sec and traffic is 50,000/sec?
Quick revision
A 95% hit rate at 50,000 requests/sec means 2,500 misses/sec. At 80%, it means 10,000 misses/sec, a fourfold increase. That is implied origin demand only under a one-miss-one-query assumption. Diagnose changed key construction, working-set growth, eviction, TTLs, region routing, and new instances. Segment hit rate by endpoint and origin cost. A high blended hit ratio can still conceal dangerous expensive misses. Mitigate the observed cause rather than lengthening all TTLs blindly.