Model and Inference Engineering · Principal
KV cache is nearly full and p99 doubled. What would you investigate?
The question
Interview question
A self-hosted model fleet serves a steady 8,500 requests per second. Yesterday p99 end-to-end latency was 4.1 seconds, today it is 9.8. GPU utilization stays near 73 percent. KV cache utilization moves from 61 to 94 percent. Time to first token moves from 430 to 940 ms, while inter-token time stays near 32 ms. What is your first hypothesis, what would prove or disprove it, and what would you change?
Take a few minutes to form your approach. Then open a worked answer and compare the decisions.
Reveal a worked answer
I would suspect a capacity problem caused by the shape of requests, even though the request count did not move. I would not call it a diagnosis yet.
One request with a long prompt and a long output can hold far more KV cache than a short one. The cache keeps the attention keys and values needed by live sequences. As sequences grow and more of them are active, cache demand grows. GPU compute utilization can look flat while memory capacity or scheduler waiting becomes the binding constraint. The average number of requests per second hides prompt tokens, output tokens, concurrency, and how long each request stays alive.
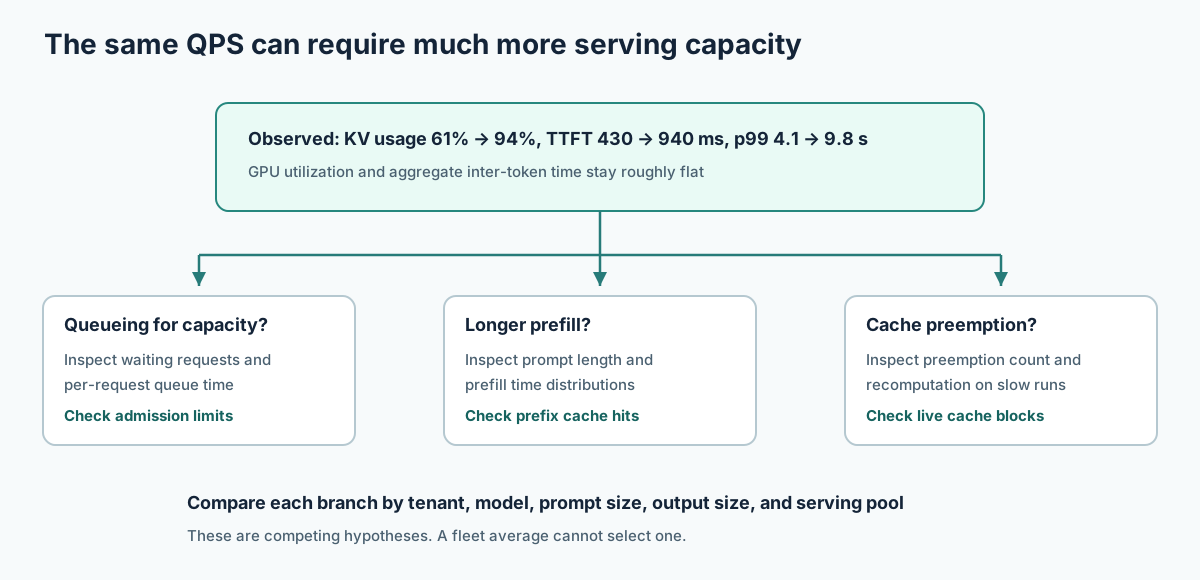
First I would confirm that these metrics cover the same model, pool, region, time window, and percentile definitions. A fleet-wide p99 and an average TTFT cannot be treated as a trace of the same requests. Then I would take the slow request sample and split end-to-end time into admission or queue time, prefill, decode, and any transport or client time. Time to first token includes more than GPU prefill. A larger prompt, longer wait in a queue, or recomputation after preemption can all move it.
My first comparison would be yesterday versus today by tenant, model, prompt length bucket, output length, and prefix cache hit. Did one tenant start sending much longer contexts? Did a prompt change destroy a common cached prefix? Did an application request longer maximum outputs, keeping sequences live longer? Did a model deployment change how much memory remains for cache? The workload can consume more cache at the same QPS.
Then I would inspect the serving engine's own signals. In vLLM, there are metrics for waiting requests, request queue time, prompt tokens, prefill time, cache usage, time to first token, and preemptions. Its documentation says insufficient KV cache can preempt requests and later recompute them, hurting end-to-end latency. Rising preemption counts paired with slow requests would strengthen the cache pressure hypothesis. If preemptions stay at zero but queue time climbs, the scheduler may be waiting for capacity. If queue time is flat and prefill time rises with prompt length, the issue may be input mix rather than cache thrash.
Unchanged inter-token time is useful but narrow. It suggests that normal decode steps may still be fast for the requests that are actively generating. It does not prove there are no stalls for the slow subset. I would inspect per-request inter-token gaps and the exact metric definition in this engine version. Some aggregate measurements hide long pauses or exclude periods before the first token.
I would take a small reversible action once the slices point to a cause. If one tenant's long requests are consuming the cache, set an admission budget based on live tokens or estimated cache blocks and preserve capacity for the interactive class. Queue, reject, or move the long work to another pool according to the product contract. A limit on maximum active sequences can reduce cache pressure, but it can also increase waiting. The decision needs an observed latency and throughput curve, not a guess.
If preemptions dominate and there is genuine memory headroom, increasing cache allocation may help. I would first check model weights, other allocations, co-tenants, and out-of-memory risk. Adding tensor or pipeline parallelism changes both memory available per device and synchronization cost. Chunked prefill and scheduler token budgets can change the balance between TTFT and decode latency. None is a free switch.
If the prefix hit rate fell because a prompt now includes a changing timestamp near the start, restoring a stable prefix may relieve both prefill and cache pressure. That would be a very different fix from buying more GPUs.
The answer I would give in the interview is a hypothesis tree, the evidence that separates its branches, and a bounded mitigation. “GPU is only 73 percent, so capacity is fine” is wrong. “KV cache is 94 percent, add GPUs” skips the investigation that tells us whether we have memory pressure, a long-prompt mix, a cache regression, or a bad scheduler policy.
If the interviewer tells me only one tenant changed its traffic, that changes the first mitigation. I would put that tenant's prompt and output length distribution beside its cache occupancy and queue contribution. If its long requests are harming the shared class, I would test a tenant-aware live-token budget or an isolated pool before changing the entire fleet's scheduler.
Suppose the preemption counter is zero. I would drop recomputation as the leading explanation and inspect queue and prefill time. High cache occupancy can still block admission without preempting a running request. A fleet average could also hide one saturated replica.
If increasing gpu_memory_utilization helps in a small test, I would check the peak workload and allocation headroom before rolling it out. A setting that makes p99 look better at noon can create OOMs at night when the model mix or co-tenants change. The metric that matters is the full latency and failure distribution under the actual traffic mix.
Primary-source notes: vLLM production metrics, vLLM optimization and preemption, PagedAttention paper. The table values in this question are hypothetical.
Related ArchCrux reading: Your LLM System Isn't Slow. Your Tail Is Slow..
Continue practicing
Related questions
Read beyond the question
Explore more model and inference engineering
Follow another question in this area, or return to the full Interview Prep index.
Browse this area →