Interview question. Customers report that an API takes 400 ms. Your server traces show 30 ms of execution. Some failed requests have no server span at all. Where could the missing time be, and what evidence would let you narrow it down?
Assume these measurements refer to the same API, but have not yet been joined by request identity. The client might use a new connection, an existing connection, a proxy, or a mobile network. Do not assume a network issue merely because the application looks fast.
Think first
A mobile API has a 600 ms p99. The application handler reports 45 ms, and twelve percent of client failures have no handler span. Your next action cannot be “add servers.” Explain a measurement plan and the first three hypotheses you would test.
Take a few minutes to form an approach, then compare it with the worked explanation.
Reveal the worked explanation
A fast server is not a fast request
A support engineer shows you a dashboard of application handler duration. The p99 is 30 ms. The client dashboard shows 400 ms. Someone suggests adding servers because the customers must be hitting a slow instance. Another person wants to replace REST with gRPC.
Neither proposal follows from the evidence. The two dashboards may not even measure the same interval. The handler timer might begin only after the server accepts a request. The client timer usually begins before it has found an address, acquired a connection, or sent any bytes.
I would start by asking exactly where each clock begins and ends. Does the client metric include retries? Does the server metric include waiting in its own executor queue? Is the server metric measured from the socket accept, the proxy handoff, or the application method? Do these measurements cover the same population of successful and failed requests?
An application trace is not a complete network trace by default. Even an HTTP client span may include connection setup in one library and exclude it in another. The OpenTelemetry HTTP span specification explicitly permits differences around those boundaries. [1]
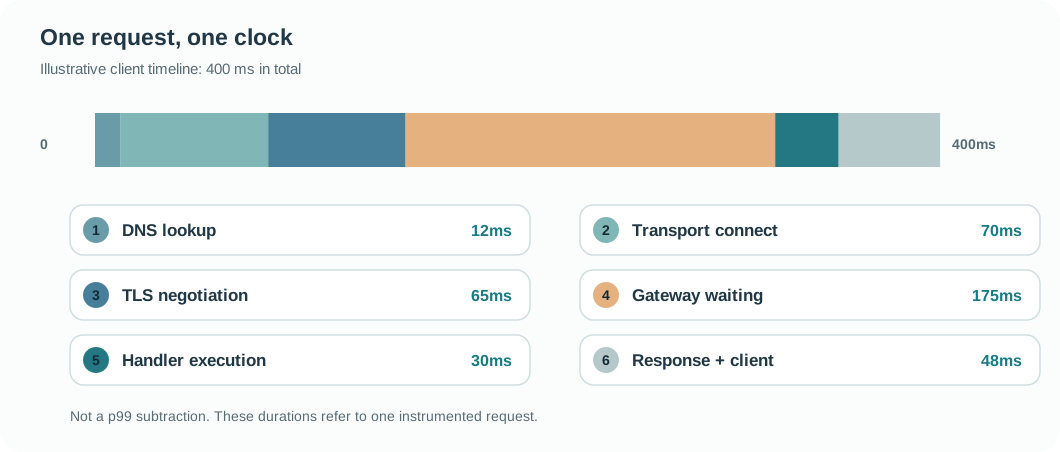
Illustrative client-to-service latency waterfall, with timing spans measured at different boundaries
Follow one request rather than subtracting two percentiles
The quickest useful experiment is an instrumented request with a shared identifier observed by the client, edge proxy, service proxy, and application. Record timestamps or durations at the actual boundaries and name their meanings.
For example, suppose one selected request produces this illustrative breakdown:
Observed interval
Elapsed
Name resolution
12 ms
Establish transport connection
70 ms
TLS negotiation
65 ms
Wait at a gateway before upstream dispatch
175 ms
Execute application handler
30 ms
Response transfer and client processing
48 ms
Client-observed total
400 ms
The arithmetic is useful only because the intervals come from one execution and have been defined as nonoverlapping. Do not obtain this table by subtracting p99 server latency from p99 client latency. The slowest one percent of requests at each layer are not necessarily the same requests.
Browser Navigation and Resource Timing expose phases such as name lookup, connection, request and response, subject to reuse and timing visibility. They do not magically expose the internal waiting time of your gateway. For that you need measurements from the gateway itself. [2]
If the gap is in DNS, investigate resolver latency, cache behavior, failure rates, and whether clients repeatedly resolve the name. If the gap is during connection or TLS setup, inspect connection reuse, packet loss, and the number of new handshakes. If it is gateway queueing, inspect its admission limits and pending upstream requests. If it is response transfer, inspect payload size and network throughput. Each measurement points to a different engineering decision.
The requests without server spans matter even more
A missing span does not prove the request never reached your infrastructure. It might have been rejected at the edge, timed out in a gateway queue, sampled out, lost its trace context, or sent to a different version of the service. Those are hypotheses to test, not equivalent explanations.
Compare edge request counts with upstream attempts and application handler starts, using a stable request identifier where possible. Reconcile both totals and error classes. Check whether the proxy returned the response itself, whether an upstream connection was attempted, and whether the client abandoned the request before dispatch. Logging only successful application starts can make an overloaded gateway invisible.
Also separate a connection attempt from an application attempt. Retransmitting a TCP packet is not the same as an HTTP client issuing a new request. The latter may create additional load and needs a separate operation contract if it changes data. A mutating HTTP retry must preserve its business operation identity and enforce duplicate-safe effects. Here we are accounting for elapsed time.
Make the diagnosis reproducible
I would run a small matrix: warm connection versus fresh connection, nearby versus distant client, small versus large response, and peak versus quiet traffic. Hold the other variables as stable as possible. This can identify whether the time is paid once per connection, once per request, or only when a shared resource is saturated.
Then compare distributions of client, edge, gateway, and application durations. Correlate by region, protocol, connection reuse, and response size. A single satisfying waterfall is not evidence that every slow request has the same cause. Sample tail cases deliberately, including failures that never produced an application span.
I would resist proposing a new transport or more servers until I could state which interval dominates and which resource causes it. A 30 ms handler proves only that the handler is fast for the requests and intervals it measured. The application may be innocent, or its own queue may be outside that timer.
Suppose that instrumentation reveals a connection-balancing gateway holding a small number of long-lived upstream connections. You add backend replicas, but the busy connections remain attached to the old hosts.
Why might adding capacity leave those new replicas almost idle?
Go deeper
More difficult measurement boundaries
A client span is not always a socket trace. Instrumentation may start before the network write or after connection acquisition. A server span may begin after a gateway has already waited for an upstream slot. Check each library's definitions before expecting parent and child spans to account for every millisecond. OpenTelemetry permits HTTP client instrumentation with attempt-level spans or a logical request span, depending on library capabilities.
Cross-origin browser resources can hide detailed phase timestamps unless the server makes them available under the browser's timing access rules. Client telemetry needs to document what is observable and what is not. For native SDKs, instrument connection acquisition and DNS directly when the runtime supports it.
There is another measurement trap: aligning timestamps from machines with different clock offsets. Compare durations recorded on the same monotonic clock when possible. When you build a cross-host timeline, uncertainty in clock synchronization should be smaller than the gap you are trying to explain. Server and client times can help establish where a request waited without pretending their raw timestamps are perfectly aligned.
Finally, the response timer might stop when headers arrive or only after reading the response body. A 1 MB streaming response can look fast under one definition and slow under the other. Make that choice visible before comparing results.
Check your reasoning
Name the boundaries of both latency measurements and avoid subtracting unrelated p99 values.
Correlate one client request through edge, proxy, upstream attempt, and handler start.
Separate warm and fresh connections and compare DNS, connect, TLS, upstream pending time, and response transfer.
Treat missing spans as ambiguous: routing, sampling, rejections, and context propagation are all possibilities.
Show which observed timing would justify a change and how to verify the change reduced client-visible latency.
Common mistake: Saying “distributed tracing will tell us” without explaining where spans start or which requests are missing.
Read the answer explanation
No, the p99s may represent different requests and intervals. — Percentiles from distinct distributions cannot be subtracted to recover a p99 for the missing interval. Compare matched requests and explicit time boundaries.
Apply it elsewhere
A scheduled data job reports 18 minutes end to end. Its worker executes for 20 seconds. How would you find the other time?
Compare your approach
Use the same measurement-boundary discipline, but examine scheduling wait, queue age, worker startup and storage reads rather than assuming the transport is the bottleneck.
One more constraint
Only requests from one country are slow. How would you distinguish routing, TLS setup, packet loss, and a regional proxy queue?
Quick revision
A fast handler does not prove the complete request is fast. I would first define the start and end of the client timer, proxy timers and application timer, including whether each includes retries or queueing. I would not subtract independent p99 numbers to infer network time. I would follow a selected request across client, edge, gateway and handler boundaries, measure connection setup separately from reused connections, and inspect the gateway's upstream waiting time. Missing handler spans are ambiguous: the request might have failed before dispatch, lost trace context or been sampled out. Then I would compare tail cases across location, protocol, connection reuse and response size. The right fix follows from an observed bottleneck rather than a guess about servers or transport.